
Figure 4.
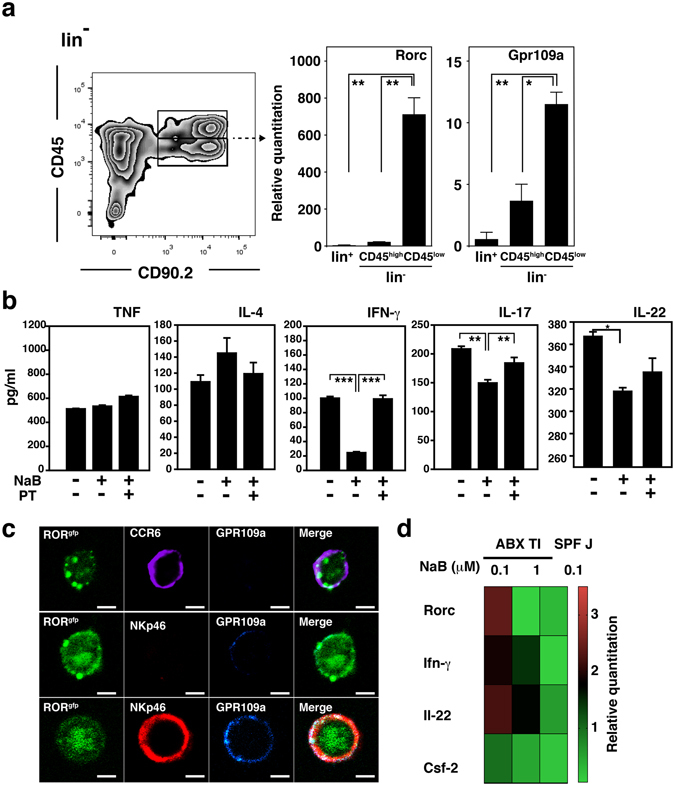
NKp46+ ILC3s responded to butyrate stimulation through GPR109a-mediated signaling. (a) Expression levels of mRNAs for Rorc and Gpr109a were determined from lin+, lin−CD45high CD90.2+, and lin−CD45lowCD90.2 cells sorted from PP cells from SPF mice. Data represent the mean ± standard deviation of three mice per group and a representative result from three independent experiments is shown. *p < 0.05 and **p < 0.01 indicate significant differences between the groups compared. (b) Levels of cytokines secreted from ILCs prepared from PPs of BALB/c nude mice stimulated with the molecules indicated and re-stimulated with PMA, ionomycin, and IL-23 were determined as described in the Methods. (c) The sorted lin−RORγtgfp/+ cells were stained with anti-CCR6 Ab, anti-NKp46 Ab, or anti-GPR109a Ab and assessed using confocal laser scanning microscopy. The scale bars represent 5 μm. (d) The lin−RORγtgfp/+ cells were prepared from terminal ileal PPs of ABX-treated SPF mice or jejunal PPs of SPF mice and stimulated in vitro with each indicated concentration of NaB for 2 hr. Levels of the listed cytokine transcripts were then measured using a quantitative real-time PCR assay. Data from three independent experiments are presented as a heat map and relative quantitation (RQ) of cDNA was calculated by the ΔΔCt method using 18S rRNA genes. Data represent the mean ± SE measured from three independent experiments. *p < 0.05, **p < 0.01, and ***p < 0.001 indicate significant differences between the groups compared.