Figure 3.

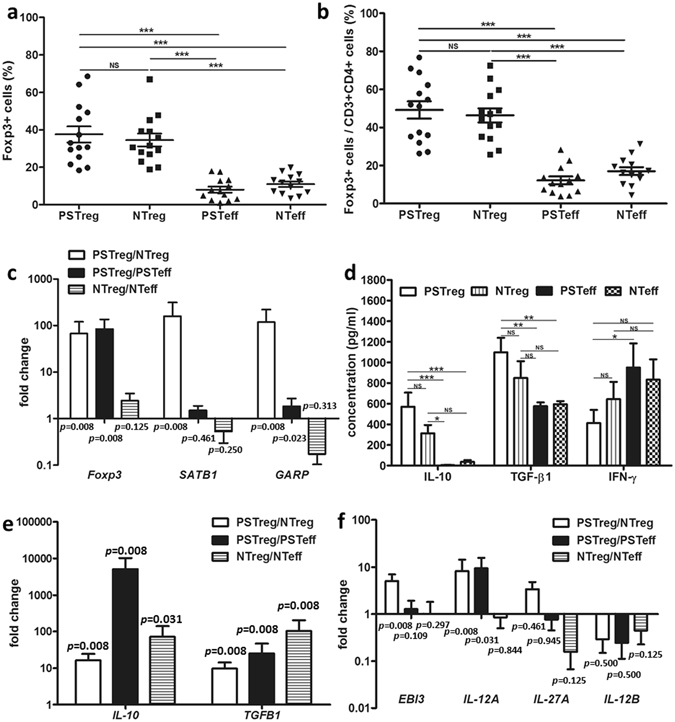
High IL-10, TGF-β1 and IL-35 secreting PS Treg generated with porcine antigen loaded DC. CD4+ T cells were isolated and cocultured with PS antigen-expressing DC for 10 days in the presence of IL-2 w/o rapamycin. (a,b) Foxp3+ cells in PSTreg and NTreg in the alive cell population and in the CD3+CD4+ cell population after 10 day coculture. For comparison PSTeff and NTeff were analyzed. Data represent 14 independent experiments with cells from 8 donors. (c) Relative quantification of Foxp3, SATB1 and GARP mRNA of PSTreg and NTreg by RT-PCR. Data represent 8 independent experiments from 6 donors. (d) Supernatants of coculture were harvested for analyzing IL-10, TGF-β1, and IFN-γ. Data represent 20 experiments from 7 donors. (e) Relative expression of IL-10- and TGFB1-mRNA expression. Data represent 8 experiments from 6 donors. (f) Relative expression of IL-35-, IL-27-, and IL-12p70 related mRNA. Data represents 8 independent experiments from 6 donors. (c,e,f) represent NTreg and PSTeff as control for PSTreg and NTeff as control for NTreg. ACTB, G6PDH or CYPB mRNA were determined from the same sample and used as endogenous reference genes. ***p < 0.001, **p < 0.01, *p < 0.05. NS, non-significant, p > 0.05. ANOVA with Bonferroni’s Multiple Comparison Test or turkey test was used to determine the statistical significance of Treg percentage (a,b), and cytokine production on protein level (d). Wilcoxon signed-rank test was used to determine statistical significance of mRNA fold change (c,e,f). Error bars: s.e.m.
