
Figure 4.
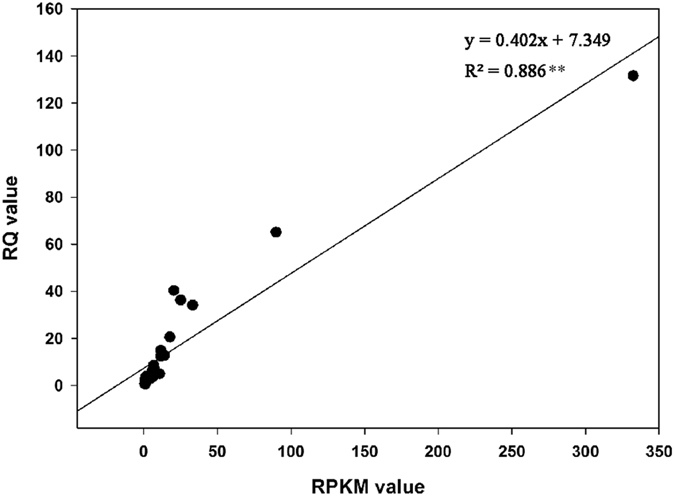
Correlation between qRT-PCR and data obtained from transcriptome analysis. The real-time PCR log2 values (x-axis) were plotted against graft healing stages (y-axis). **Indicates a significant difference at p ≤ 0.01.
Official websites use .gov
A
.gov website belongs to an official
government organization in the United States.
Secure .gov websites use HTTPS
A lock (
) or https:// means you've safely
connected to the .gov website. Share sensitive
information only on official, secure websites.
Correlation between qRT-PCR and data obtained from transcriptome analysis. The real-time PCR log2 values (x-axis) were plotted against graft healing stages (y-axis). **Indicates a significant difference at p ≤ 0.01.