
Figure 7.
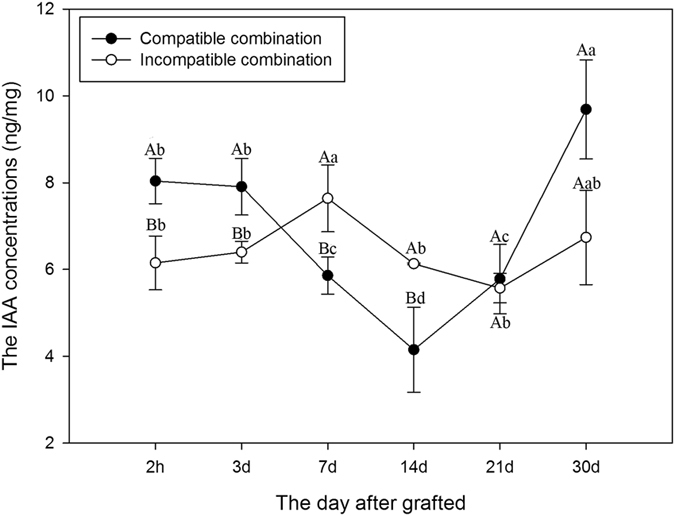
Comparison of the IAA concentrations in graft union between the compatible and incompatible combination. Data were mean ± SE of three biological replicates. Different lowercase letters indicate significant difference at the 0.05 level among 6 sampling sites, different capital letters indicate significant difference at the 0.05 level between compatible combination and incompatible combination at the same sampling site, respectively.