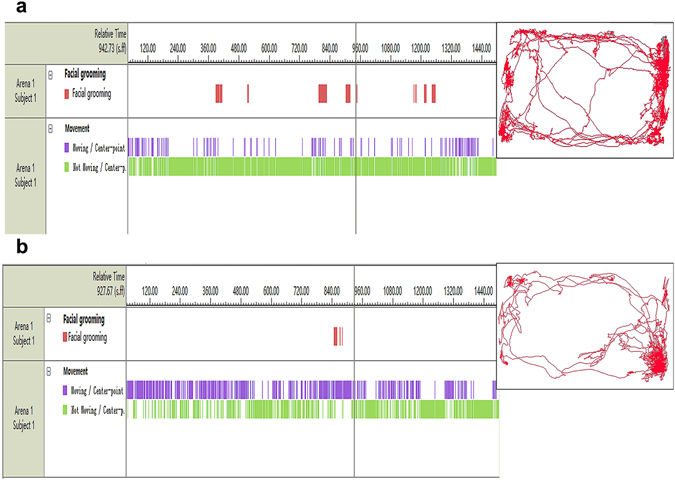
Figure 2.

Tracking of rat activity using a video tracking system (EthoVision XT35). Rat activity trajectories after infusion. (a) An animal’s path after saline infusion. (b) After IS infusion, the rats exhibited greater face-grooming and quiescent behavior times. The panels on the left illustrate the time and duration of each behavior. The red bars represent face-grooming activity. The blue bars illustrate moving activity. The green lines show quiescent behavior. The square area represents the open arena, and the representative path of one rat during the 30 min after infusion is shown in red. IS, inflammatory soup.
