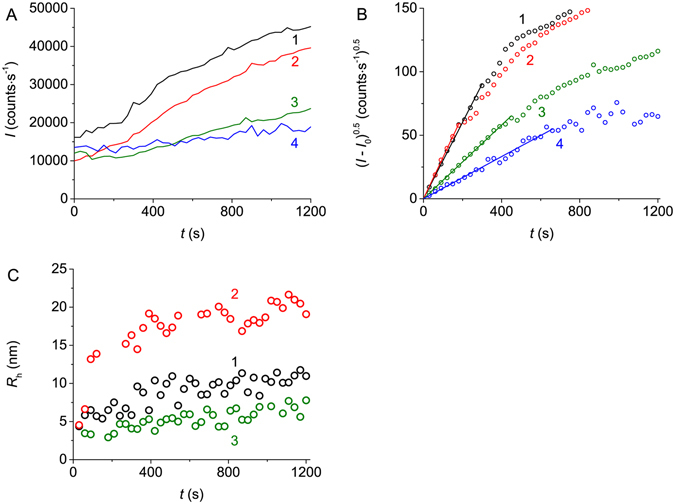
Figure 3.

Effect of Arg on the kinetics of aggregation of BSA (1 mg∙mL−1) registered by DLS (0.1 M Na-phosphate buffer, pH 7.0, 70 °C). (A) The dependences of the light scattering intensity (I) on time obtained at the following concentrations of Arg: 0 (1), 50 (2), 350 (3) and 1000 mM (4). (B) The kinetic curves represented in the coordinates {(I − I 0)0.5; t}. Concentrations of Arg: 0 (1), 200 (2), 350 (3) and 1000 mM (4). (C) The dependences of the hydrodynamic radius (R h) of protein aggregates on time obtained at the following concentrations of Arg: 0 (1), 200 (2) and 1000 mM (3).
