
FIGURE 8.
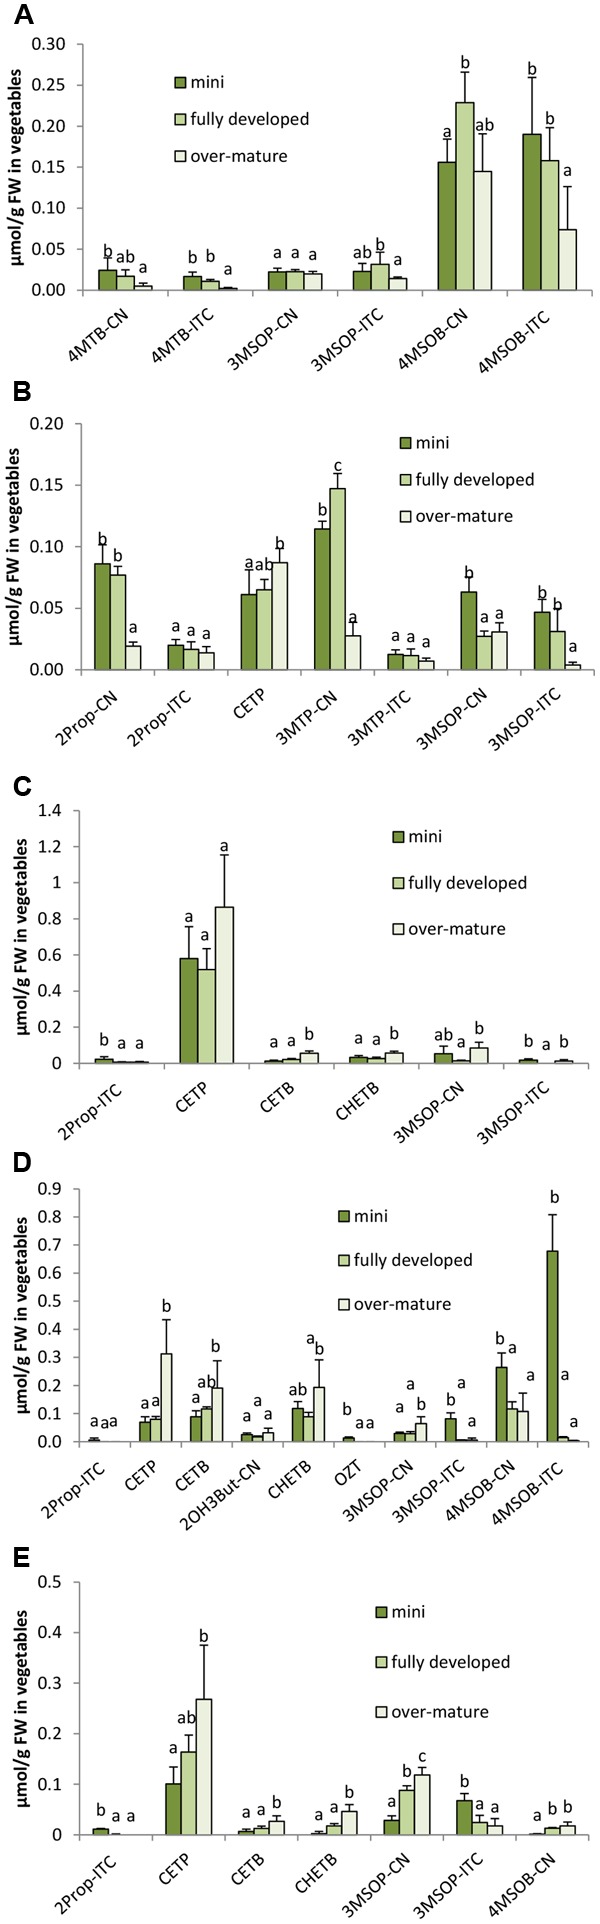
Influence of head ontogeny on the glucosinolate hydrolysis products [μmol/g FW] in broccoli (A), cauliflower (B), white cabbage (C), red cabbage (D), and savoy cabbage (E). Abbreviations: see Table 2. Small letters indicate significant differences between means of glucosinolate hydrolysis products concentrations of different head developmental stages (p ≤ 0.05) as determined by Tukey’s HSD test.