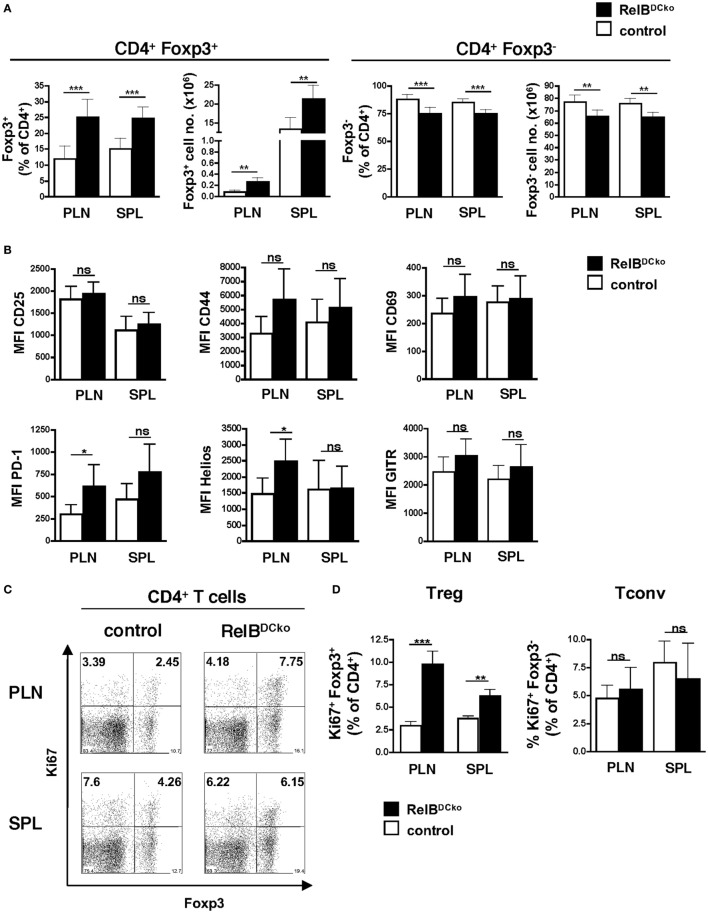
Figure 2.
Mice with a RelB deficiency in dendritic cell display an increased frequency of proliferating Foxp3+ regulatory T cells (Tregs). (A) Cells from peripheral LN (PLN) and SPL of control and RelBDCko mice were analyzed by flow cytometry for surface CD4 and intracellular Foxp3 expression. Percentages and absolute numbers of Foxp3+ Treg and Foxp3− conventional T cells (Tconv) among CD4+ T cells in peripheral lymphoid organs of control mice (n ≥ 7) and RelBDCko mice (n = 7) are shown. (B) Geometric MFI of CD25, CD44, CD69, PD-1, Helios, and GITR expression by CD4+ Foxp3+ Treg in PLN and SPL of control mice (n ≥ 3) and RelBDCko mice (n ≥ 3) are displayed. (C,D) Cells from PLN and SPL of control and RelBDCko mice were analyzed by flow cytometry for surface CD4 and intracellular Foxp3 and Ki67 expression. (C) Representative dot plots showing Ki67 and Foxp3 expression among CD4+ T cells. Numbers indicate the percentages of cells in each quadrant. (D) Percentages of proliferating Ki67+ Foxp3+ Treg and Ki67+ Foxp3− Tconv among CD4+ T cells in PLN and SPL of control mice (n = 8) and RelBDCko mice (n = 6) are shown. (A,B,D) Data represent the mean values + SD. Mann–Whitney test was used for statistical analyses: ns, not significant, *p < 0.05, **p < 0.01, ***p < 0.001.

