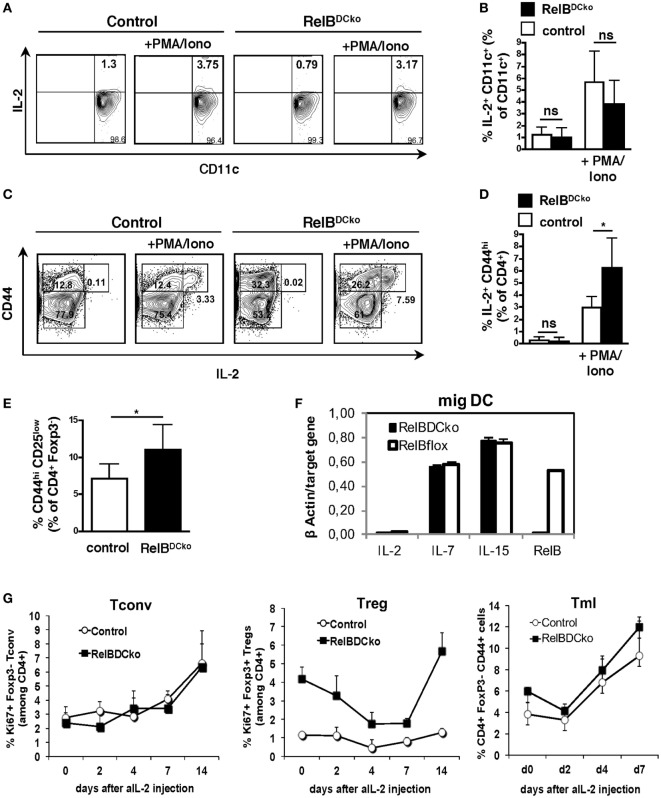
Figure 5.
IL-2 produced by CD4+ CD25int CD44hi T cells is required for regulatory T cell (Treg) maintenance in RelBDCko mice. (A–D) Single cell suspensions from peripheral LN (PLN) of control and RelBDCko mice were either left unstimulated or activated with PMA/ionomycin for 5 h in the presence of brefeldin A. After incubation cells were stained (surface: CD11c, CD4, and CD44; intracellular: IL-2) and analyzed by flow cytometry. (A) Representative dot plots showing expression of CD11c and IL-2 among CD11c+ dendritic cell (DC). Numbers in each quadrant indicate the percentages of cells gated on CD11c+ cells. (B) Graphs display the percentages of IL-2+ CD11c+ DC among CD11c+ DC compiled from five independent experiments with one mouse per genotype and condition in each experiment. (C) Representative dot plots showing expression of CD44 and IL-2 among CD4+ T cells. Numbers in the quadrants indicate the percentages of cells gated on CD4+ cells. (D) Compiled date from percentages of IL-2+ CD44+ cells among CD4+ T cells of five independent experiments with one mouse per genotype and condition in each experiment are displayed. (E) Percentages of CD25int CD44hi cells among CD4+ T cells in PLN of control (n = 6) and RelBDCko mice (n = 7) from five independent experiments are shown. (F) mRNA expression of IL-2, IL-7, and IL-15 in sorted migratory CD40hi DC from PLN of control and RelBDCko mice analyzed by qRT-PCR. (G) Injection of an IL-2 neutralizing antibody abrogated Treg but not conventional T cells (Tconv) cell division in RelBDCko mice. 1 mg αIL-2 antibody was injected intraperitoneal into RelBDCko and control mice. Before injection and 2, 4, 7, 14, and 21 days afterward blood samples were taken, stained for CD4, CD44, Foxp3, and Ki67, and analyzed by flow cytometry. Kinetics of the percentages of proliferating CD4+ Ki67+ Foxp3− Tconv, CD4+ Ki67+ Foxp3+ Tregs, and CD4+ CD44high Foxp3− memory-like T cells after αIL-2 injection are shown in the diagram. Three mice per genotype and experiment were used. Depicted is one representative experiment from four experiments. (B,D,E,F) Data represent the mean values + SD. For statistical analyses student’s t-test was performed: ns, not significant, *p < 0.05.

