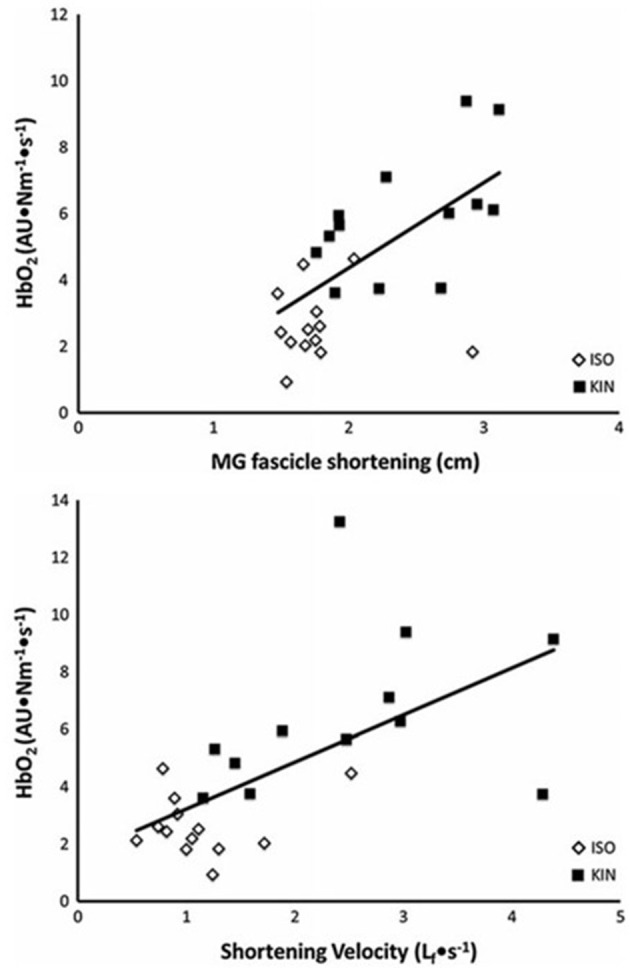
Figure 3.

The relationship between the rate of energy use to maintain a given torque (HbO2·impulse−1) and magnitude of muscle fascicle shortening (top) and fascicle shortening velocity (bottom). The open diamonds represent measurements made during a fixed-end contraction (ISO). The filled squares represent those measurements made when additional shortening was permitted (KIN). From Fletcher et al. (2013a).
