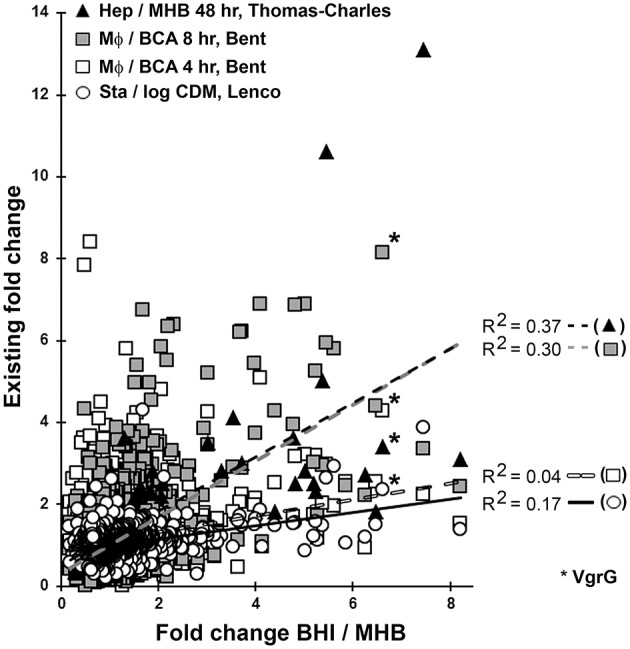
Figure 1.

Comparative omics. The fold changes (FC) for each of the 845 proteins we quantified in both BHI- and MHB-grown Ft were plotted against the transcriptional FC for the same genes determined by Bent et al. (2013) at 4 h (white squares), 8 h (gray squares), and Thomas-Charles et al. (2013) (black triangles). Four lines of best fit (least squares, best fit linear regression) are shown for comparison of our data with that of Bent 4 h (R2 = 0.04), Bent 8 h (R2 = 0.30), Thomas-Charlie (R2 = 0.37), and Lenco et al. (2009) (R2 = 0.17, open circles solid black line). Values for VgrG (6.6—BHI/MHB; 8.1—Bent, 8 h; 4.3—Bent, 4 h; 3.4—Thomas Charles, 48 h; 2.4—Lenco) are indicated by asterisks to facilitate interpretation of the data. MHB, Mueller-Hinton Broth; BHI, Brain Heart Infusion Broth; MΦ, Macrophages; BCA, BHI supplemented with Casamino Acids; CDM, Chamberlain's Defined Medium; Stat., Stationary Phase; Log, Logarithmic phase.
