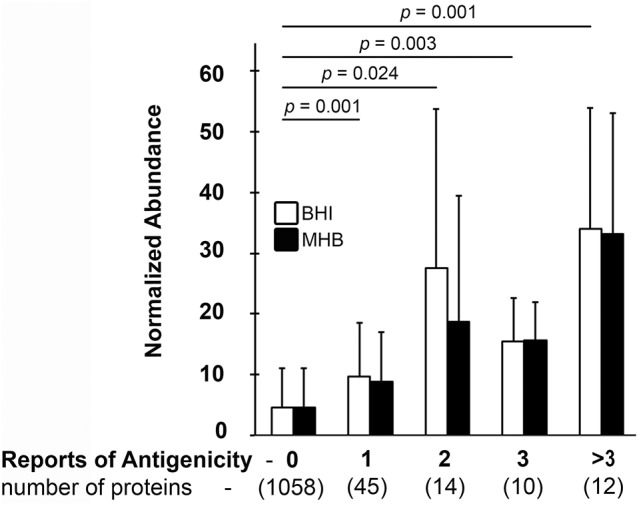
Figure 2.

Ft protein abundance correlates with antibody reactivity. The average normalized abundance of the 1,139 Ft proteins we detected (Y-axis) was plotted against the number of times (0 to >3) that each protein has been reported as Ab reactive with infection-derived sera (X-axis). X axis values in parentheses indicate the number of Ft proteins with the indicated number of reports of sero-reactivity (0 to >3). Means and standard deviations from two to three biological replicates are indicated; statistical analysis was via 2-tailed, heteroscedastic T-test with Bonferroni correction with four comparisons. Indicated p-values are for the BHI dataset.
