
Figure 1.
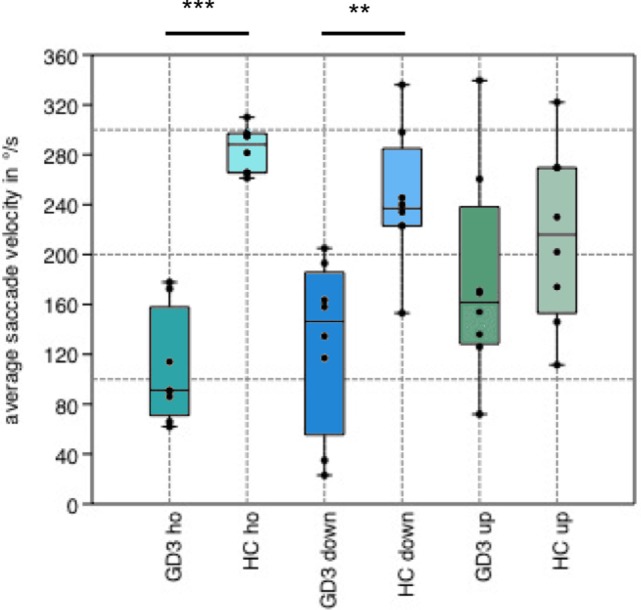
Boxplot of average saccade velocity. Boxplot showing the average saccade velocity of horizontal (ho), downward (down), and upward (up) saccades in the step paradigm. Gaucher’s disease type 3 (GD3) patients performed horizontal (p = 0.0009) and downward (p = 0.004) saccades in significantly reduced velocity compared to healthy controls (HCs), whereas there was no difference in upward saccades (p = 0.3).