
Figure 2.
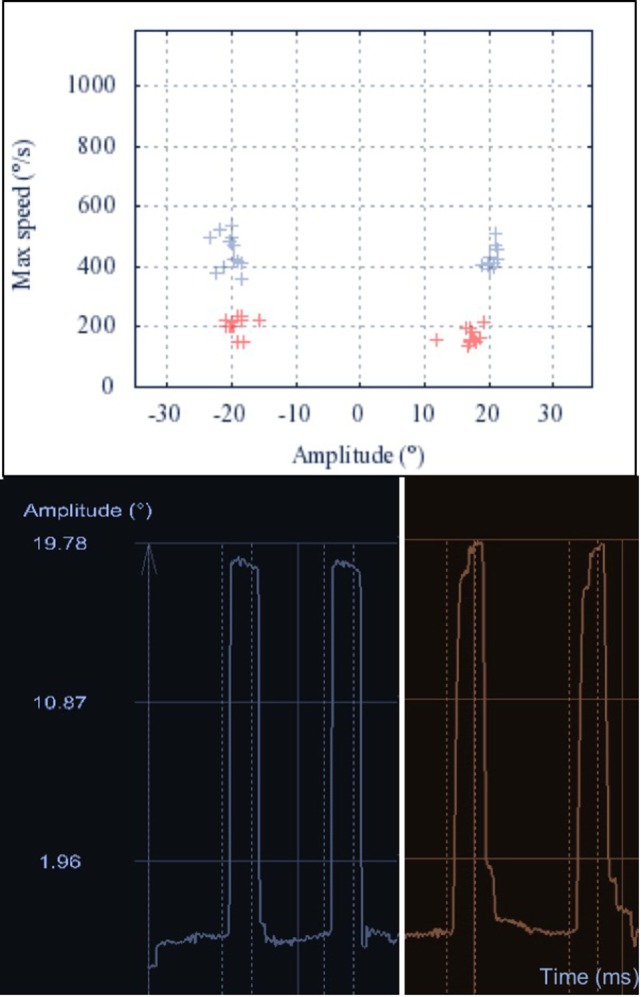
Main sequence of horizontal saccades. Upper: the main sequence illustrates the linear dependency of peak velocity and amplitude of a saccade. The main sequences of 20° horizontal saccades are shown for one Gaucher’s disease type 3 (GD3) patient (red) and one healthy control (HC) (blue). Lower: representative raw recordings of two exemplary horizontal saccades for the same GD3 patient (red, right) and HC (blue, left). The broken lines represent the appearance and disappearance of the 20° lateral stimulus. The GD3 saccades show longer duration, with decreased average velocity. Additionally, the gain of the first saccade is mildly reduced and one correction saccade is needed to reach the target.