
FIGURE 1.
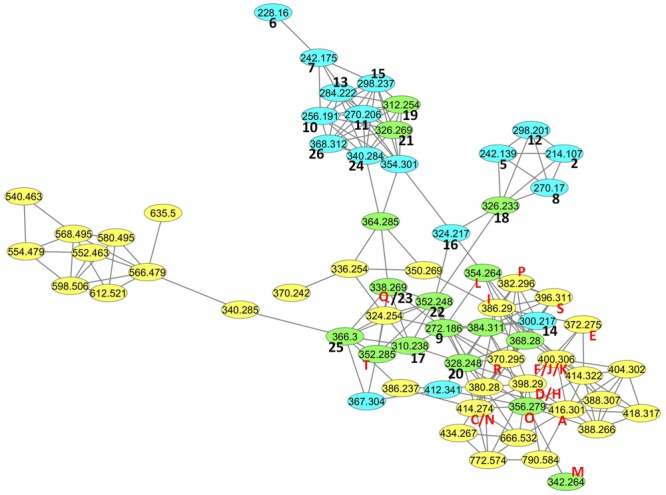
Molecular network containing the AHLs detected in strain MOLA401 microfractions (yellow), and in analytical standards (blue). Identical matches are in green. In the graph, the parent mass is reported on the node, and for each node the corresponding table entry codes are reported if applicable. Entry numbers for Supplementary Table S1 are in black, and Table 1 entry letters are in red.