
Figure 1.
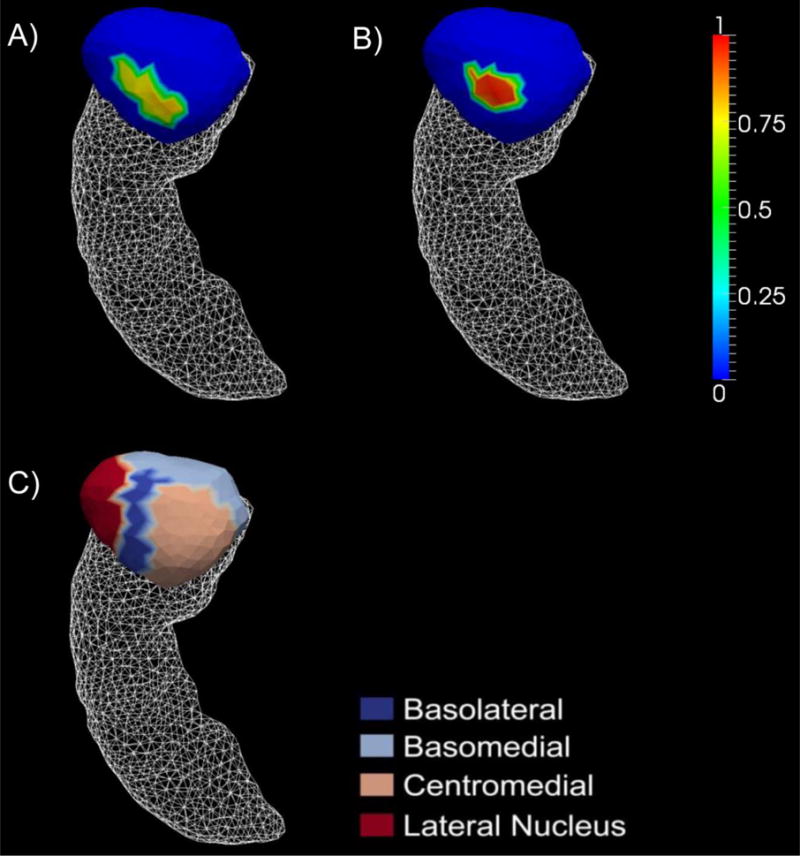
Panel A) represents the vertex-wise significant shape differences of the left amygdala between the ε4 carriers and the non-carriers of the entire AD group whereas panel B) represents the differences when restricted to the AD-YO group. The color bar values are the differences in z-score of the shape-based diffeomorphometry. Panel C) represents a division of the left amygdala template surface into four compatible subregions: the basolateral, basomedial, centromedial, and lateral nucleus.