
Figure 6.
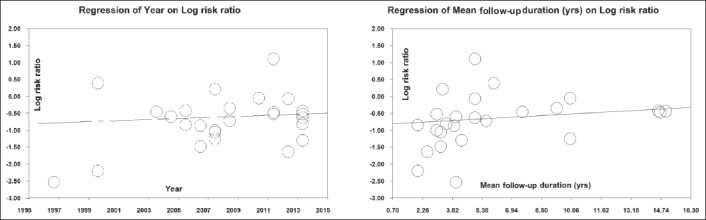
(A) Meta-regression analysis showing regression of publication year on log risk ratio. (B) Meta-regression analysis showing regression of mean follow-up duration on log risk ratio. Circles represent each study in the meta-analysis
Official websites use .gov
A
.gov website belongs to an official
government organization in the United States.
Secure .gov websites use HTTPS
A lock (
) or https:// means you've safely
connected to the .gov website. Share sensitive
information only on official, secure websites.
(A) Meta-regression analysis showing regression of publication year on log risk ratio. (B) Meta-regression analysis showing regression of mean follow-up duration on log risk ratio. Circles represent each study in the meta-analysis