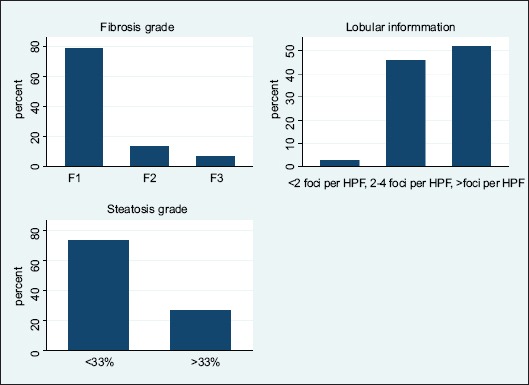
Figure 1.

The frequency (percentage) of histologic findings in the nonalcoholic fatty liver disease group. The degree of steatosis (top), lobular inflammation degree based on foci of lobular inflammation in high power field of microscopic view (middle), and fibrosis degree (bottom)
