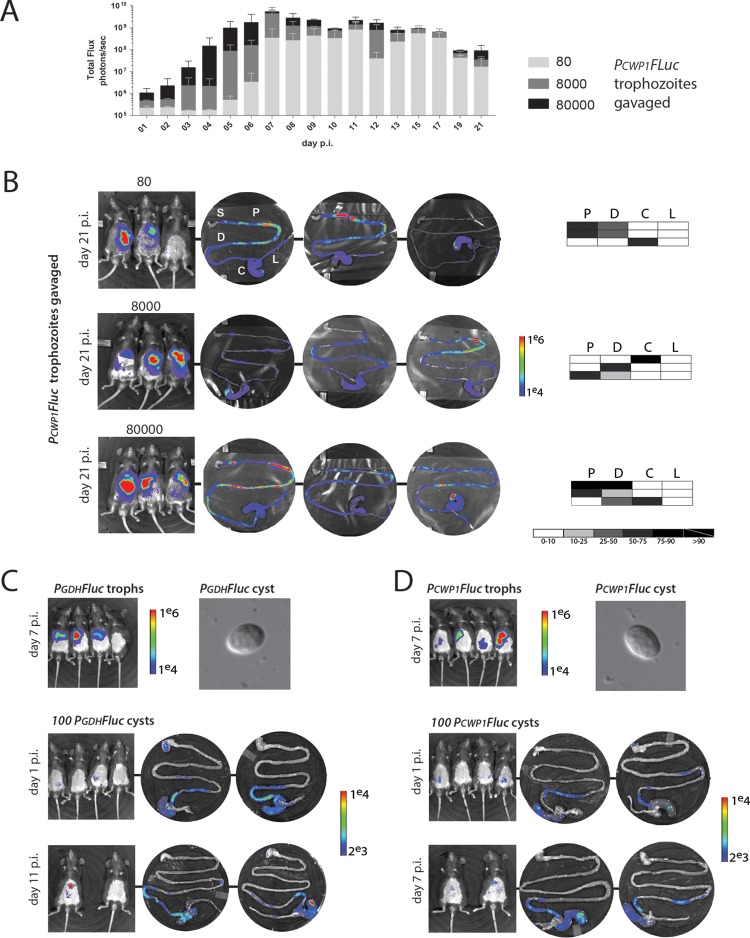
FIG 5 .
Variations in trophozoite inoculation density or infections with cysts result in similar temporal and spatial dynamics. (A) To assess the impact of cell density on the initiation of encystation, cohorts of three mice were infected with three different concentrations of PCWP1-FLuc strain trophozoites (80, 8,000, or 80,000), and bioluminescence was imaged and quantified daily over 21 days in total. (B) In vivo and ex vivo BLI is presented following sacrifice at day 21 p.i. for each inoculation density. The shaded charts summarize the percentage of maximal bioluminescent signal from the PCWP1-FLuc strain in each of the four gastrointestinal regions (P, proximal small intestine; D, distal small intestine; C, cecum; L, large intestine) for each individual animal infected with that initial inoculum. The stomach (S) is shown for orientation but always lacks bioluminescence. (C) A cohort of mice was infected with the PGDH-FLuc strain. Cysts were harvested throughout the infection from feces (see Materials and Methods), and 100 cysts were used to infect an additional cohort. Noninvasive imaging of infections using whole-animal BLI and ex vivo imaging of the gastrointestinal tract are shown for days 1 and 11 p.i. (D) A similar study was performed using the encystation-specific PCWP1-FLuc strain (days 1 and 7 p.i. shown).

