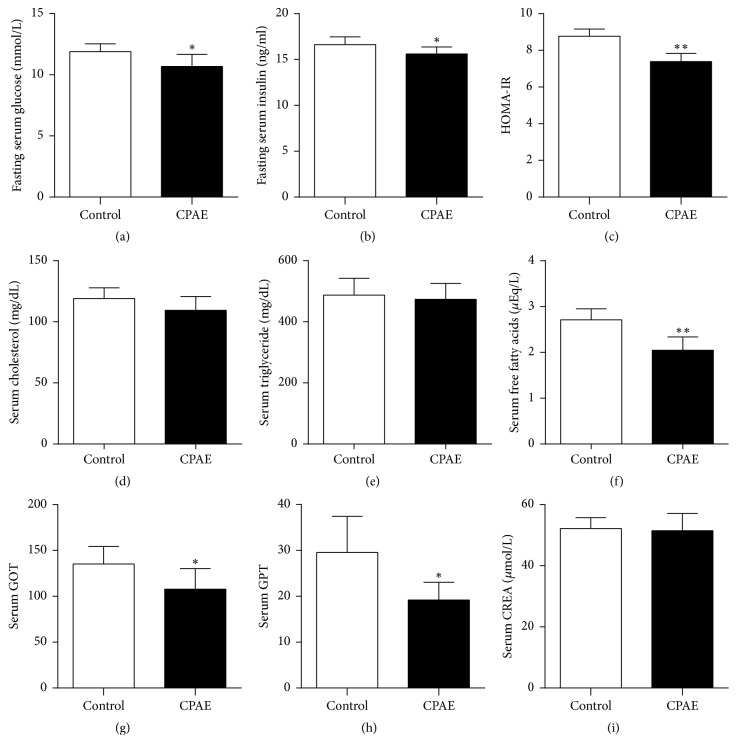
Figure 2.
CPAE treatment affects glucose and lipid levels and hepatorenal function in SHR/cp rats. (a) Fasting serum glucose, (b) fasting serum insulin, (c) HOMA-IR, (d) serum cholesterol, (e) serum triglyceride, (f) serum free fatty acids, (g) serum GOT, (h) serum GPT, and (i) serum CREA of SHR/cp rats treated with 0.5 g/kg CPAE or untreated controls (n = 6) were measured as described in Materials and Methods. Values are expressed as the mean ± SD. ∗P < 0.05 and ∗∗P < 0.01 versus control group. n = 6 per group.

