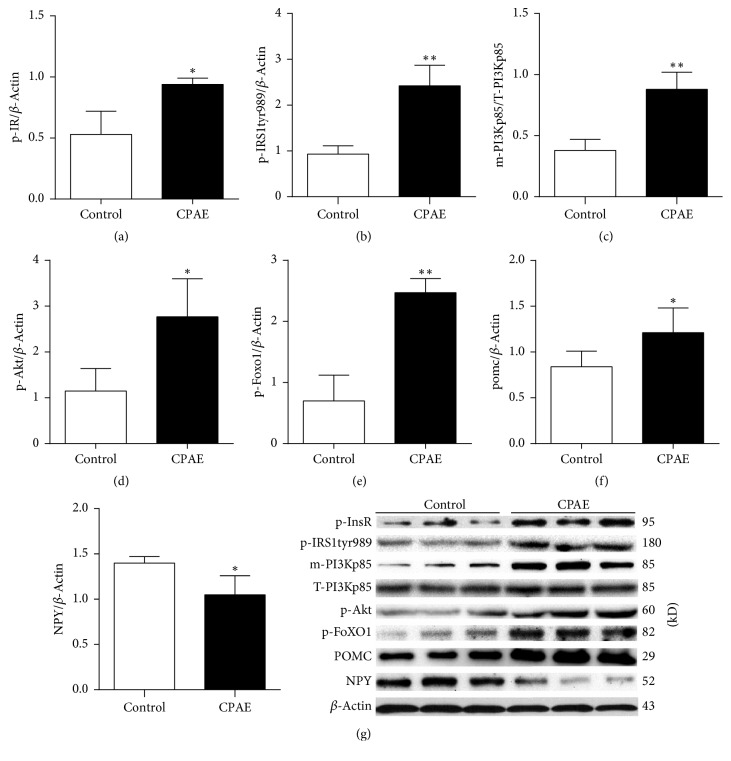
Figure 5.
CPAE activates the insulin-signaling pathway in the hypothalamus of SHR/cp rats. (a) The phosphorylation level of InsR, (b) the phosphorylation level of IRS1tyr989, (c) the level of m-PI3Kp85, (d) the phosphorylation level of Akt, (e) the phosphorylation level of FoXO1, (f) the protein expression level of POMC, and (g) NPY of SHR/cp rats treated with 0.5 g/kg CPAE or untreated controls. All of the results were determined by Western blot analysis as described in Materials and Methods. Values are expressed as the mean ± SD. ∗P < 0.05 and ∗∗P < 0.01 versus control group. n = 6 per group.

