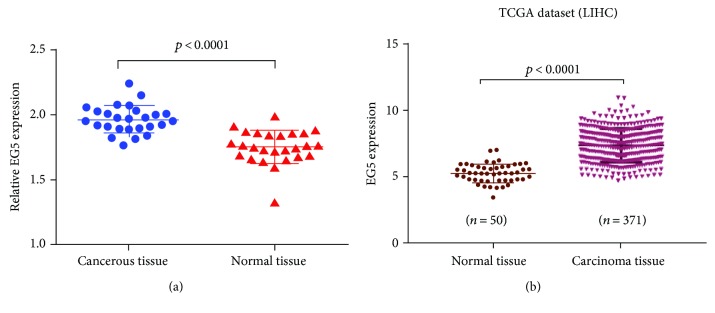
Figure 1.
Eg5 mRNA expression in HCC and normal tissues. (a) One-step qPCR was performed to compare Eg5 mRNA expression levels in cancerous tissues with those in adjacent normal tissues. The Eg5 mRNA level in the HCC tissue (1.976 ± 0.02068) was higher on average than that in the matched adjacent tissue. β-Actin was used as an internal control. (b) In TCGA dataset, the Eg5 mRNA level in the carcinoma tissue was higher on average than that in the matched normal tissue (p < 0.0001).

