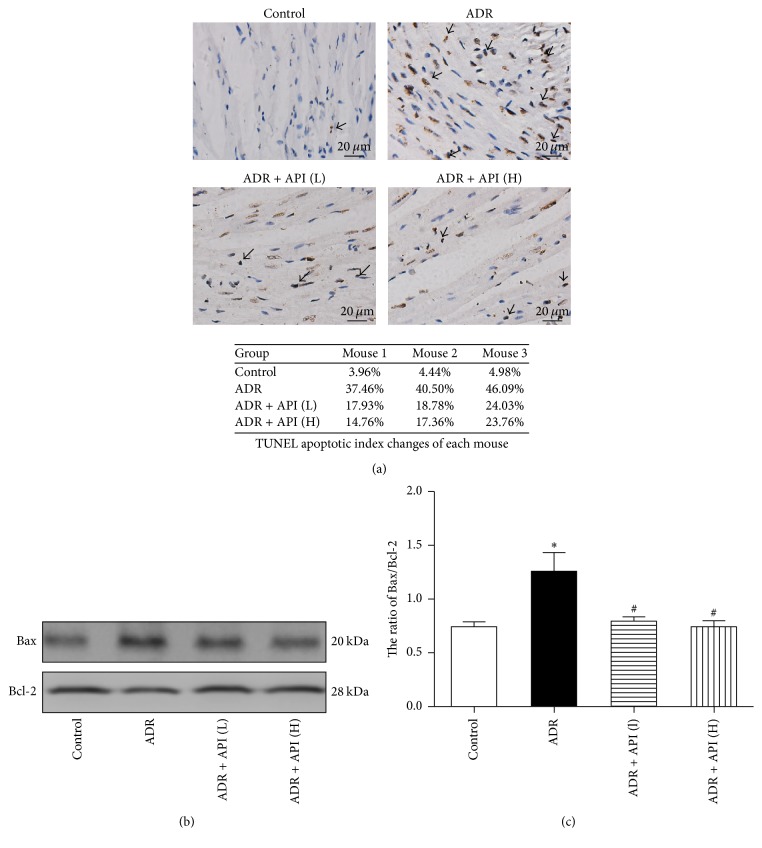
Figure 2.
Effect of apigenin on apoptosis and related protein expression in hearts from ADR-treated mice. (a) Representative pictures of TUNEL assay results (magnification: 400x) and TUNEL apoptotic index were determined by calculating the ratio of TUNEL-positive cells to total cells. Arrows indicate positive cells; n = 3 per group. (b) Representative pictures of Bcl-2 and Bax expression; n = 5 per group. (c) Quantitative analysis of Bax/Bcl-2 ratios; n = 5 per group. Values are presented as the mean ± SEM. ∗P < 0.05 compared with the control group; #P < 0.05 compared with the ADR model group.

