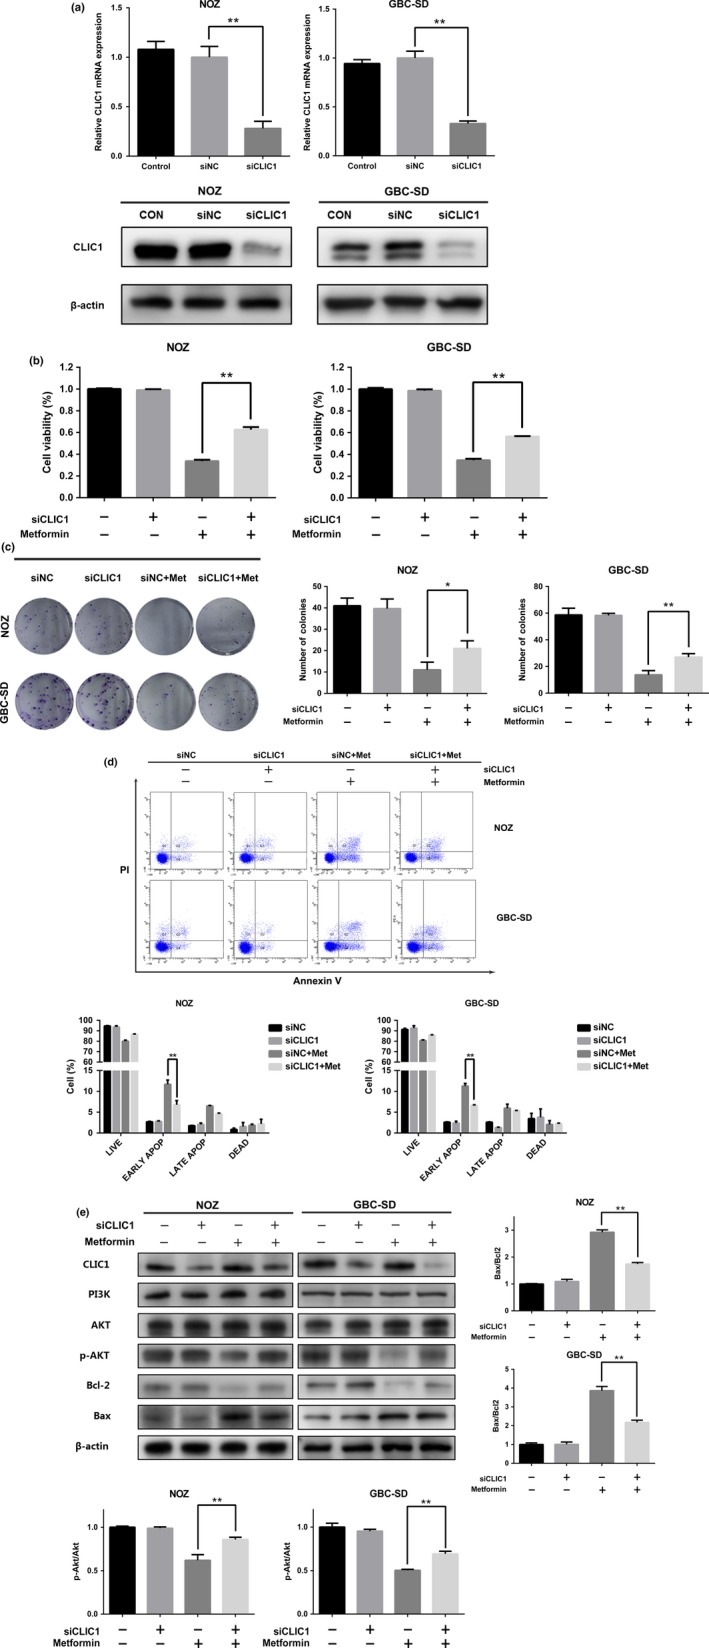
Figure 5.

Downregulation of CLIC1 increases GBC survival in the presence of metformin. NOZ and GBC‐SD cells were divided into four groups: siNC, siCLIC1, siNC + metformin and siCLIC1 + metformin. Cells were transfected with siRNA for 36 h and then treated with metformin for 24 h. (a) The mRNA and protein expression levels of CLIC1 after siRNA knockdown. (b) Cell viability was measured using the CCK8 assay. Data are presented as the mean ± SD (n = 3) (c) All groups were allowed to form colonies in fresh medium in the absence of metformin for 14 days. The colony numbers (mean ± SD, n = 3) are shown. (d) The number of apoptotic cells was assessed by flow cytometry. The percentages of apoptotic cells are shown (mean ± SD, n = 3). (e) Western blotting was performed to examine the expression levels of CLIC1, PI3K, Akt, p‐Akt, Bcl‐2, and Bax with β‐actin as a loading control. The relative ratios of p‐Akt to Akt and Bax to Bcl‐2 are presented as the mean ± SD (n = 3). All the data are presented as the mean ± standard deviation from three independent experiments. * P, 0.05, ** P, 0.01 versus the control group.
