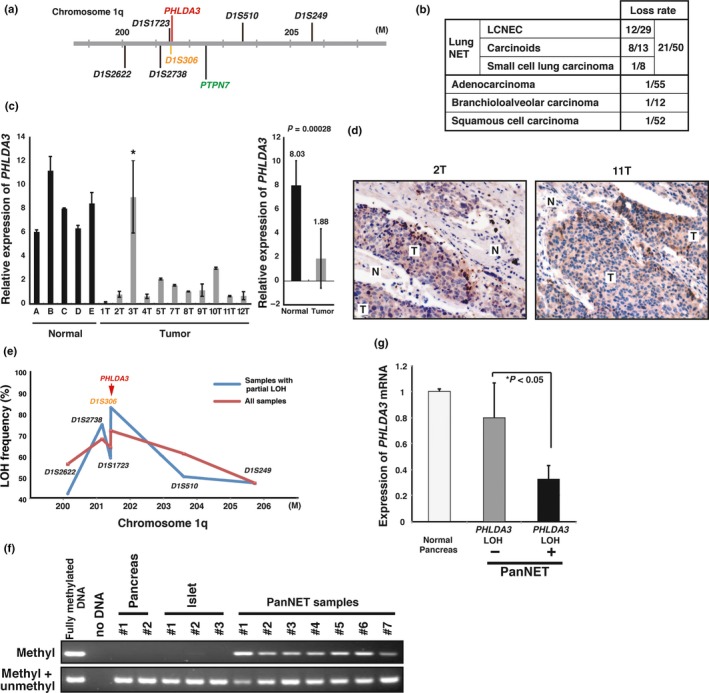
Figure 3.

PHLDA3 locus is lost and PHLDA3 expression is downregulated in neuroendocrine tumors (NET). (a) Chromosomal locations of the PHLDA3 gene and microsatellite markers used in the study. D1S306 is located just next to the PHLDA3 gene (32 kb upstream). (b) Chromosome copy number alterations analyzed by MCG cancer array‐800 CGH. (c) Expression of PHLDA3 was analyzed by quantitative RT‐PCR. Total RNA were prepared from normal lung tissues (derived from patients A–E) and LCNEC (derived from patients 1T–12T). In the right column, the mean expression ± SD of PHLDA3 expression in normal lungs and tumor samples is shown. (d) LCNEC tumor sections were subjected to immunohistochemistry to detect activated Akt. Stronger positive brown signals were detected in the tumor regions (T) compared to normal tissue regions (N). (e) Loss‐of‐heterozygosity (LOH) frequency for each microsatellite marker. Frequencies from all samples (shown by red line) and frequencies from samples showing LOH partially within the analyzed region (shown by blue line) are described. (f) Methylation status of the PHLDA3 promoter in normal pancreas, normal isolated islets and PanNET (samples showing LOH at the PHLDA3 locus were analyzed). Genomic DNA from the indicated samples were analyzed by methylation‐specific PCR. (g) PHLDA3 gene expression in PanNET. Total RNA were prepared from normal pancreas and PanNET. RNA was pooled from five normal pancreases for the normal controls. RNA was isolated from PanNET samples with (10 samples) or without LOH (7 samples). Gene expression was quantitated by RT‐PCR and normalized to GAPDH.
