Figure 3.

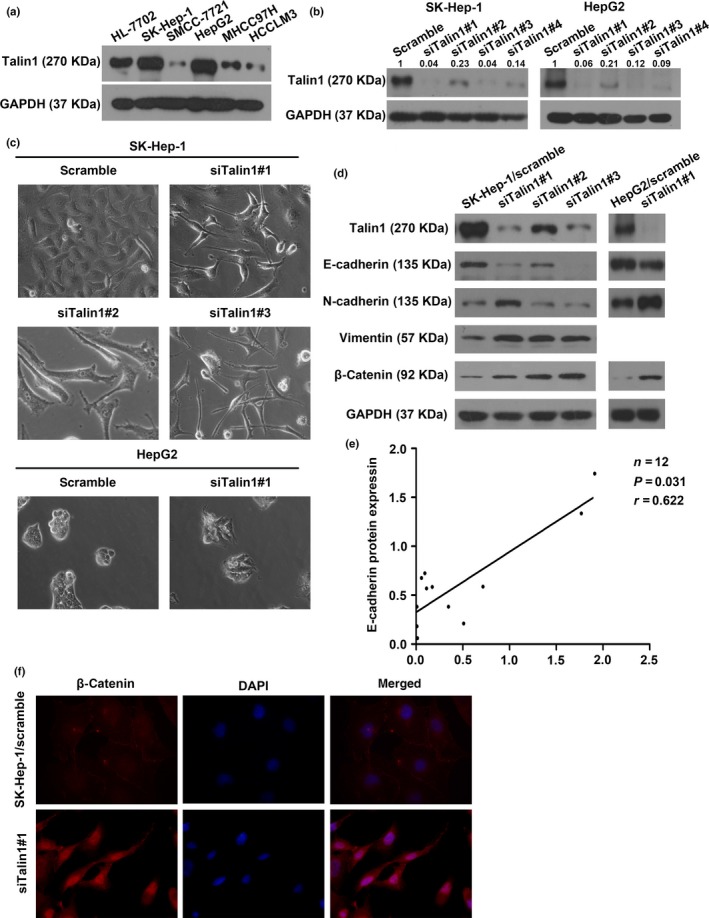
Knockdown of Talin1 induces epithelial–mesenchymal transition in hepatocellular carcinoma (HCC) cells. (a) Talin1 expression was assessed in indicated HCC cell lines by Western blot analysis. (b) Western blot analysis showed knockdown of Talin1 protein in SK‐Hep‐1 and HepG2 cells transfected with Talin1‐specific siRNA#1, #2, #3, or #4. Talin1 was quantified as integrated density to represent the amount of protein. Numerical values represented the quantified data as normalized to the scramble group. (c) SK‐Hep‐1 and HepG2 cells transfected with scrambled or Talin1‐specific siRNA are shown by phase contrast microscopy. Original magnification, ×400. (d) Western blot analysis for the expression of Talin1, E‐cadherin, N‐cadherin, vimentin, and β‐catenin in Talin1‐silenced SK‐Hep‐1 and HepG2 cells. (e) Correlation between Talin1 and E‐cadherin protein expression was detected in 12 pairs of HCC tissues and corresponding adjacent non‐tumor tissues by Western blot analysis. Spearman's rank correlation, r = 0.622; P = 0.031. (f) Immunofluorescence staining showed that knockdown of Talin1 altered the subcellular redistribution of β‐catenin. Blue, DAPI; red, β‐catenin antibody.
