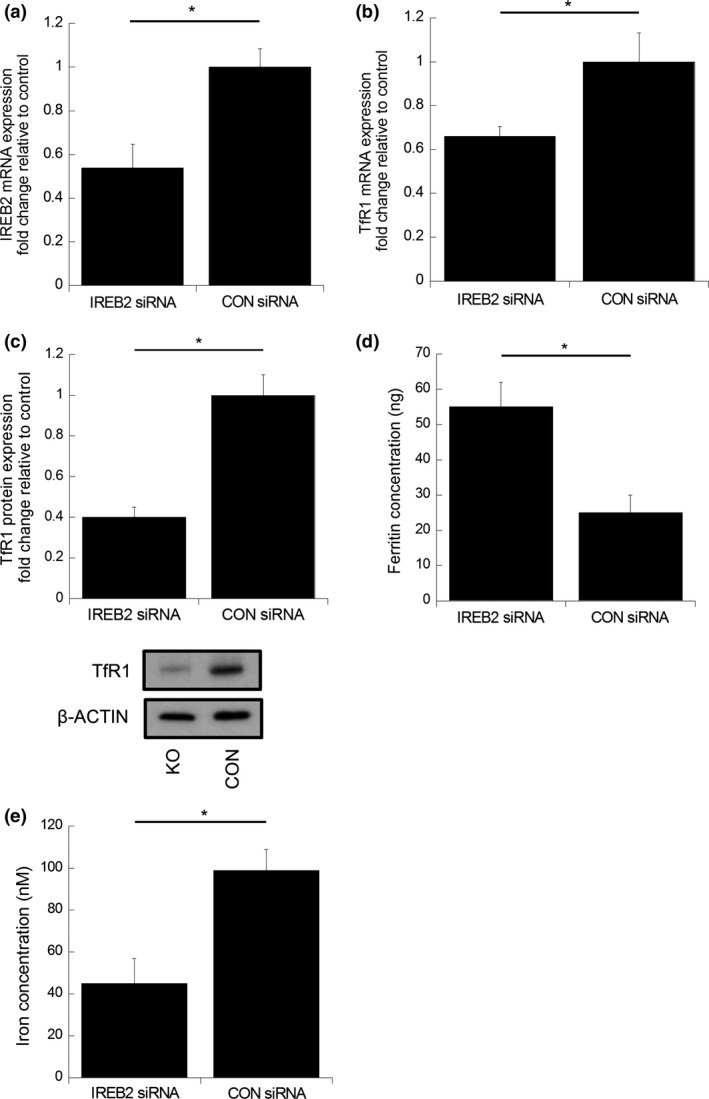
Figure 3.

Iron regulatory protein‐2 (IRP2) silencing in a colorectal cancer cell line suppresses TfR1 expression and total cellular‐iron concentration while augmenting ferritin concentration. Normalized quantitative RT‐PCR (a) IRP2 and (b) TfRC mRNA expression in RKO cells co‐cultured with IRP2 siRNA for 24 h compared to control siRNA. Data expressed as mean fold change in mRNA expression, normalized to control siRNA cells. Error bars denote ± SEM with * representing statistical significance when P < 0.05 and n = 3. (c) TfR1 protein expression changes in RKO cells co‐cultured with IRP2 siRNA or control siRNA for 24 h. Data expressed as mean fold change in protein expression, normalized to non‐treated control cells and β‐actin loading control. Error bars denote ± SEM with P‐values representing statistical significance when P < 0.05 and n = 3. (d) Ferritin concentration determined by ELISA in RKO cells co‐cultured with IRP2 siRNA or control siRNA for 24 h. Error bars denote ± SEM with P‐values representing statistical significance when P < 0.05 and n = 6. (e) Total cellular iron concentrations in cells co‐cultured with IRP2 siRNA or control siRNA. Error bars denote ± SEM with P‐values representing statistical significance when P < 0.05 and n = 6.
