
Figure 5.
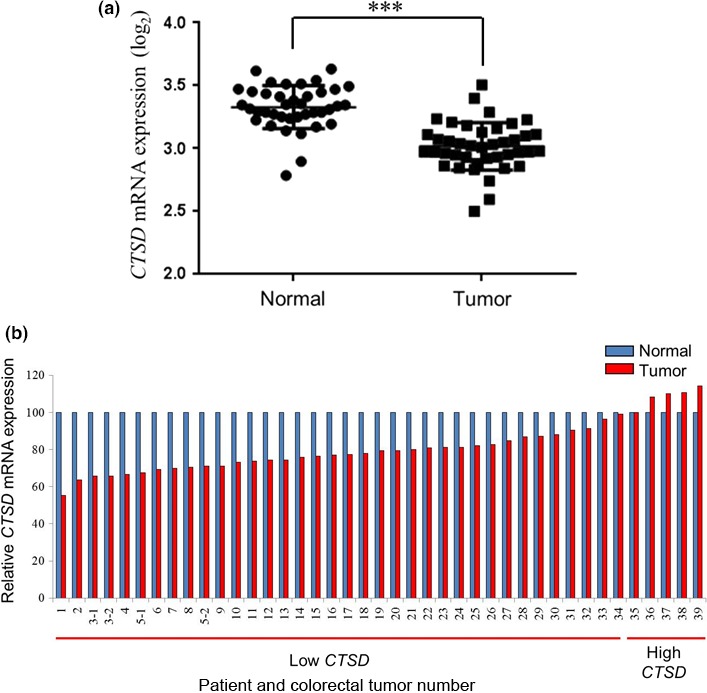
Downregulated cathepsin D gene expression levels in colorectal tumors compared with matched normal tissues. (a) CTSD mRNA expression levels (log2) of clinical colorectal tumor tissues (n = 41) and their matched normal tissues (n = 39) were quantified by a transcriptome analysis. Data are presented as mean ± SD. ***P < 0.00001, Student's t‐test. (b) CTSD mRNA expression levels of the clinical colorectal tumor relative to those of the matched normal tissue, determined by setting the normal tissue value as 100%, were divided into two groups, that is, low and high CTSD expression in tumor tissues.