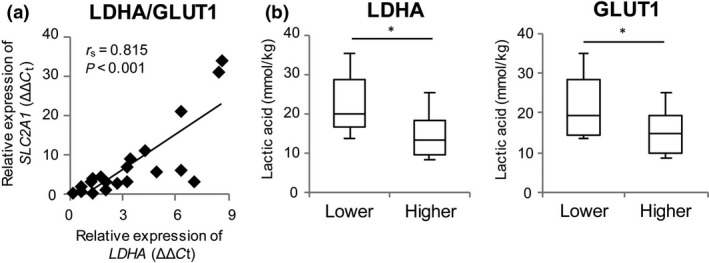
Figure 2.

Expression of LDHA and GLUT1 in head and neck squamous cell carcinoma. (a) Correlation between expression of LDHA and GLUT1 mRNA in head and neck squamous cell carcinoma (n = 20). r s is the Spearman rank correlation coefficient. (b) Concentrations of lactic acid in tissues expressing lower and higher levels of LHDA (low, <3, n = 8; high, ≥3, n = 8) or GLUT1 (low, <4.2, n = 8; high, ≥4.2, n = 8). mRNA of these genes was measured by real‐time RT‐PCR. *P < 0.05 by Student's t‐test.
