
Figure 5.
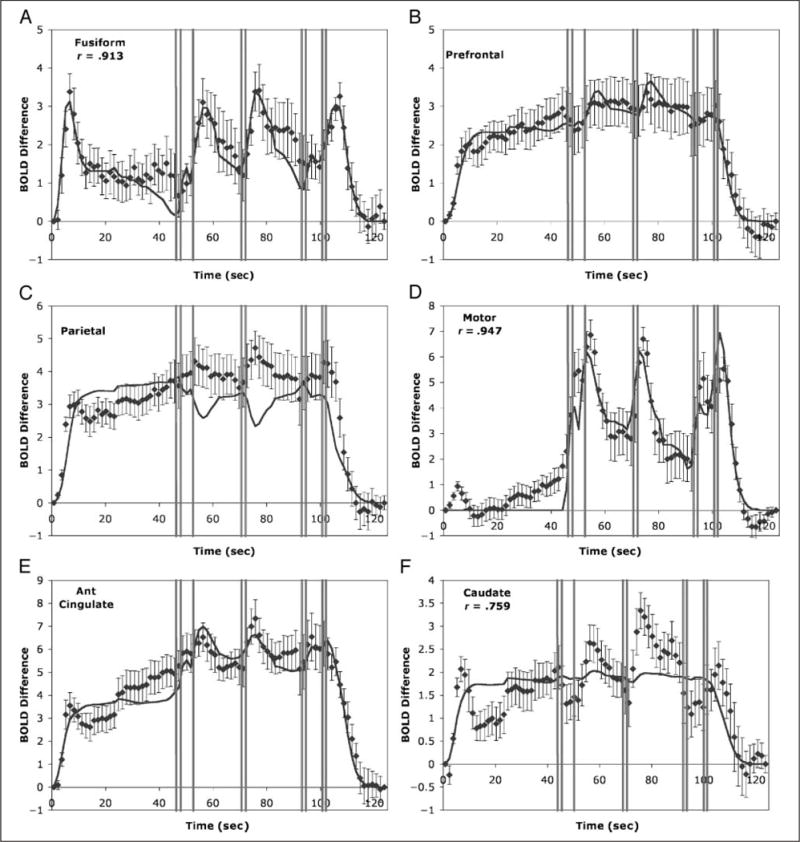
Mean change in BOLD signal for the six predefined regions of the experiment for which ACT-R makes predictions. The mean BOLD responses are displayed along with their standard errors. The solid curve gives the predictions of the ACT-R model. The vertical bars indicate where the nine responses occurred: (A) fusiform (mean BOLD signal 480) reflecting the visual module; (B) prefrontal (mean BOLD signal 463) reflecting the retrieval module; (C) parietal (mean BOLD signal 551) reflecting the imaginal module; (D) motor (mean BOLD signal 476) reflecting the manual module; (E) anterior cingulate (mean BOLD signal 592) reflecting the goal module; and (F) caudate (mean BOLD signal 594) reflecting the procedural module.