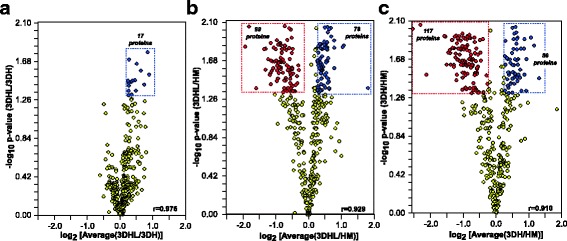
Fig. 3.

Pairwise proteome comparisons of the three constructs. a 3DHL vs. 3DH (b) 3DHL vs. HM (c) 3DH vs. HM. Proteins that meet established criteria for significance (p < 0.05) and abundance ratios (>20%) are shown in blue and red (higher abundance for each pairwise comparison are in blue and those in lower abundance are in red). Pearson correlations for each comparison are indicated in the lower right of each plot
