Fig. 5.

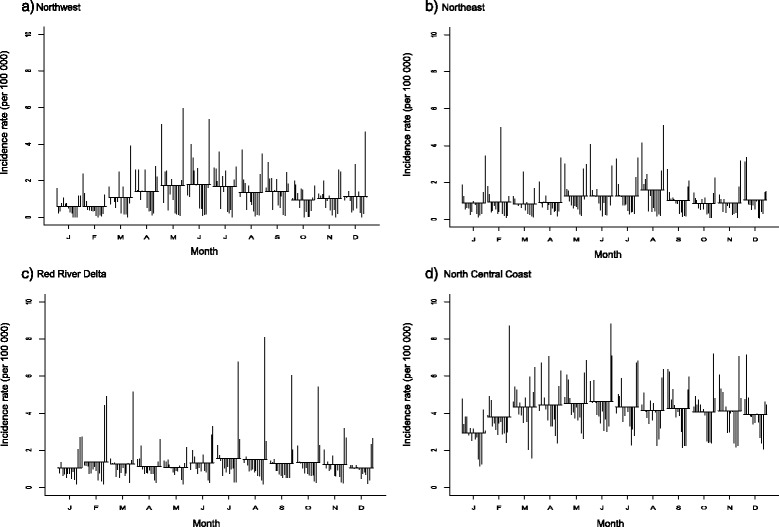
Seasonal cycle subseries plot of the monthly incidence rates (per 100,000) of BD, 1999–2013. a Northwest. b Northeast. c Red River Delta. d North Central Coast

Seasonal cycle subseries plot of the monthly incidence rates (per 100,000) of BD, 1999–2013. a Northwest. b Northeast. c Red River Delta. d North Central Coast