
Fig. 6.
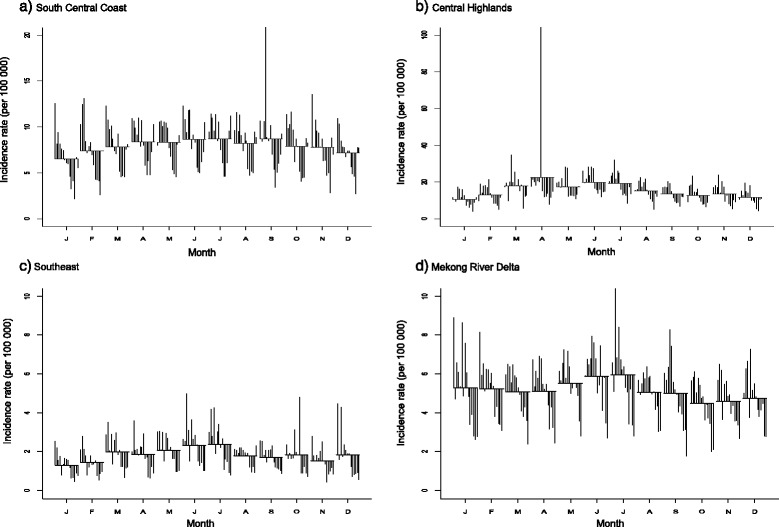
Seasonal cycle subseries plot of the monthly incidence rates (per 100,000) of BD, 1999–2013 (each plot has different Y-axis scales). a South Central Coast. b Central Highlands. c Southeast. d Mekong River Delta
Official websites use .gov
A
.gov website belongs to an official
government organization in the United States.
Secure .gov websites use HTTPS
A lock (
) or https:// means you've safely
connected to the .gov website. Share sensitive
information only on official, secure websites.
Seasonal cycle subseries plot of the monthly incidence rates (per 100,000) of BD, 1999–2013 (each plot has different Y-axis scales). a South Central Coast. b Central Highlands. c Southeast. d Mekong River Delta