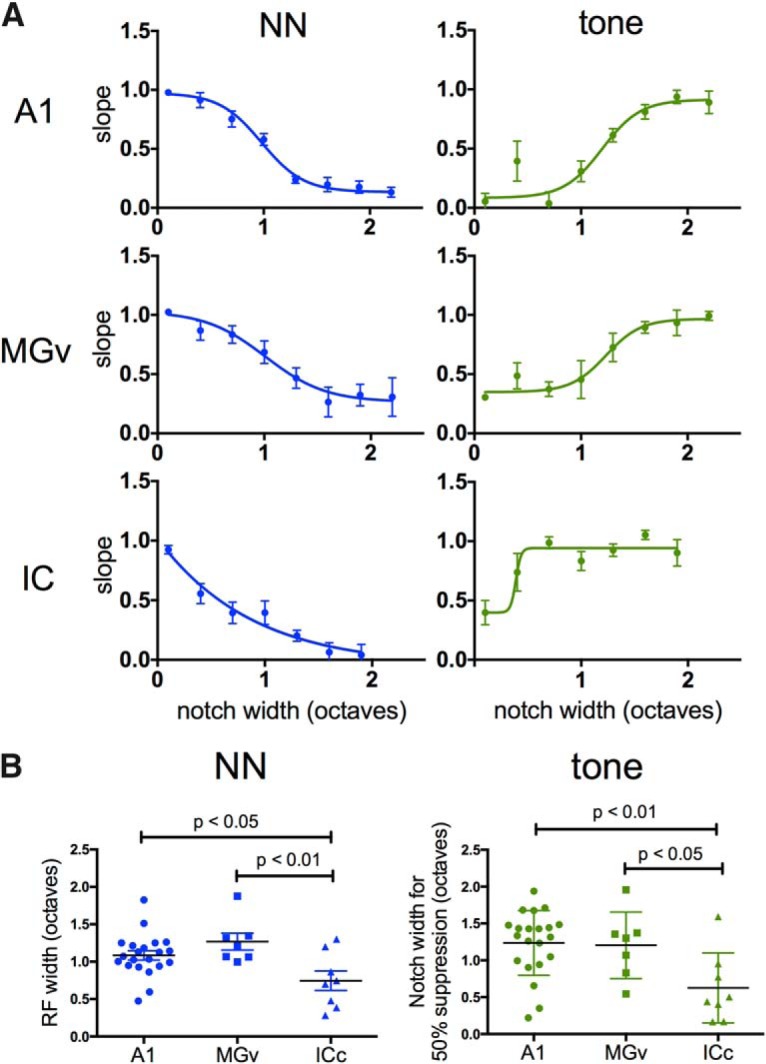
Figure 9.

Comparison of RFs and response suppression in A1, MGv, and ICc. A, NN-evoked (left) and tone-evoked (right) LFP response functions in A1, MGv, and ICc. Response magnitude normalized to plateau value for each animal; notch width is absolute value (unlike previous figures). B, Comparison of RF width and suppression of tone-evoked response, based on notch width producing 50% max response in A; individual data points are shown with group means. ICc exhibited narrower RFs and suppression of tone-evoked responses at narrower notch widths.
