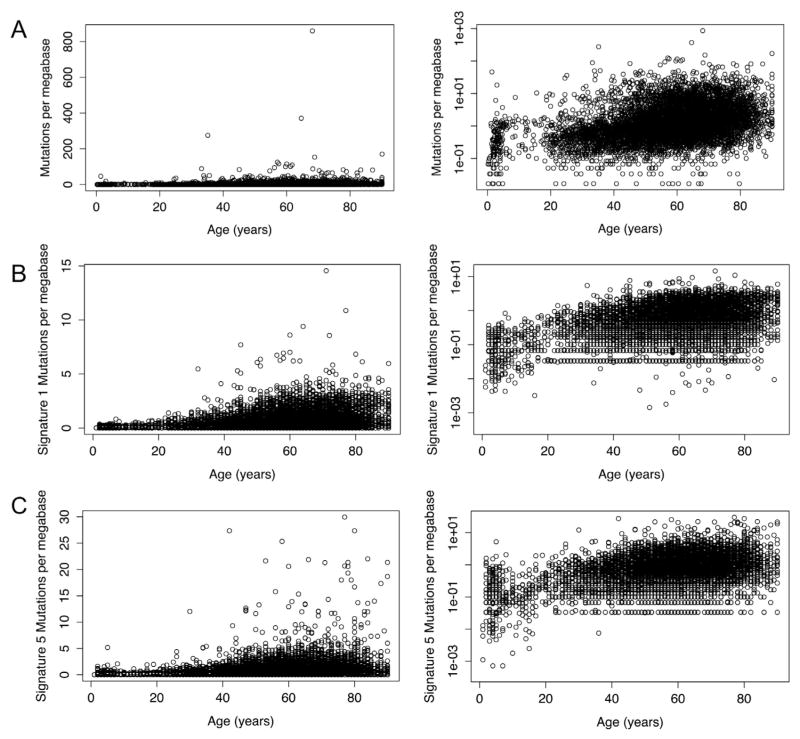
Fig. 3.
Linear and exponential mutation accumulation. (A) Mutations in whole exomes per megabase in tumors vs age of patient at diagnosis. The increase is better modeled as an exponential relationship (right) than as a linear one (left) (r = 0.36 vs r = 0.07). (B) Signature 1 (age-associated), exome mutations in tumors per megabase vs age of patient at diagnosis. The frequency of somatic mutations belonging to mutation signature 1 as identified by Alexandrov et al. is better modeled as an exponential relationship than as a linear one (r = 0.296 vs r = 0.4). (C) Signature 5 mutations per megabase vs age of patient at diagnosis. Like signature 1 mutations, the frequency of somatic mutations belonging to mutation signature 5, as identified by Alexandrov et al., is better modeled as an exponential relationship than as a linear one (r = 0.23 vs r = 0.43). Data for (A) is from Milholland et al. (2015); data for (B) and (C) is from Alexandrov et al. (2015). Plots and correlation coefficients calculated using R (R Core Team, 2014).

