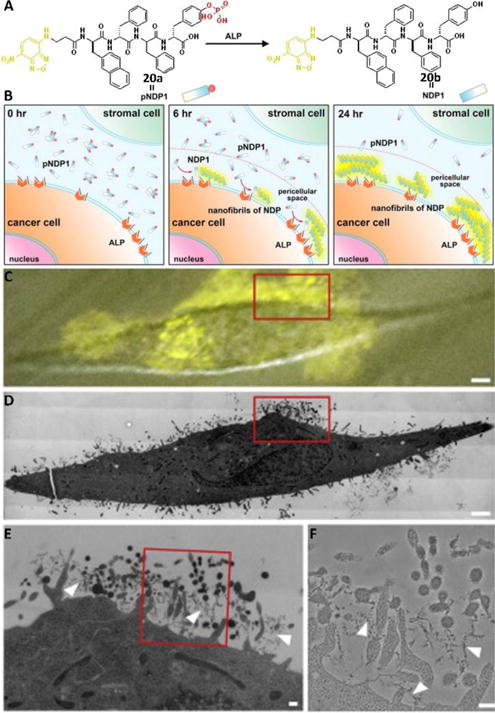
Fig. 10.

(A) Molecular structures of pNDP1 and NDP1 and the conversion catalyzed by ALP under physiological conditions (orange part is the fluorophore, NBD; red part is the enzymatic trigger, phosphate). (B) Illustration of the EISA of NDP1 to form fluorescent pericellular nanofibrils in co-culture. (C) Merged image (differential interference contrast and fluorescence microscopy images) of treated HeLa cells (grown on marked Aclar discs and incubated for 6 h with 500 μM pNDP1) recorded only a few minutes before the sample was high-pressure frozen for TEM; note the highest intensity of the fluorescence signal on the cell surface, indicating a high abundance of nanofibrils in that region of the cell. (D) High-magnification electron microscopy image shows a slice through the same cell depicted in (C). Note that this is a montage image that consists of more than 200 individual high magnification image tiles. (E) Higher-magnification electron micrograph of the cell region highlighted by the red box in (C) and (D). This region of the cell also corresponds to the area of highest fluorescence signal in (C). (F) High-magnification electron micrographs of the red boxed area in (E). Note the presence of nanofibrils (white arrowheads) containing NDP1s. Adapted with permission from ref. 33. Copyright 2016, Elsevier.
