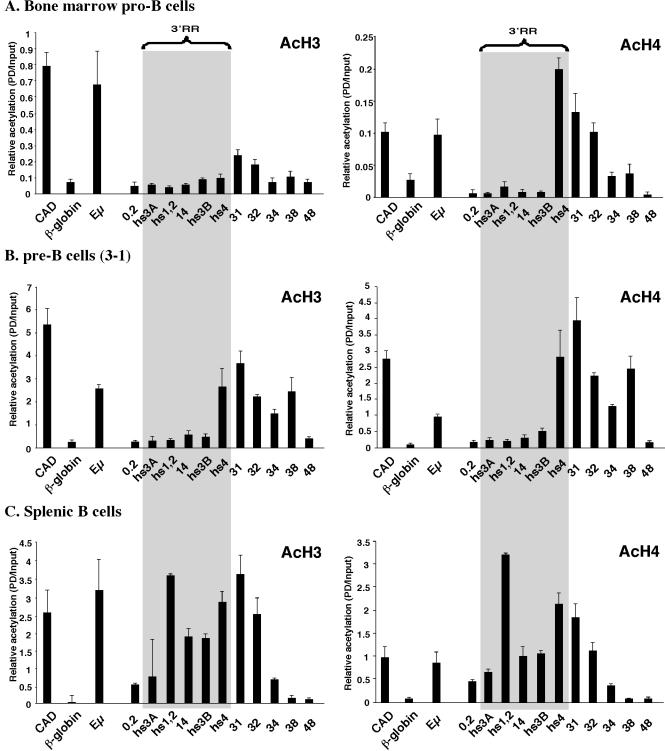
FIG. 3.
Association of AcH3 and AcH4 at the 3′ end of the Igh locus in mouse primary pro-B-cell and splenic B-cell populations and a pre-B-cell line. Shown are real-time PCR analyses of a ChIP done with anti-AcH3 and with anti-AcH4 on pro-B cells isolated from the bone marrow of a RAG1-deficient mouse (A), the 3-1 pre-B-cell line (B), and splenic B cells (C). The primers used are indicated below the histogram bars. Data are plotted as a numerical comparison of signal in immunoprecipitated samples to that detected in the input, as described in Materials and Methods. A gray swath represents the 3′ RR extending from hs3A to hs4.

