
Figure 1.
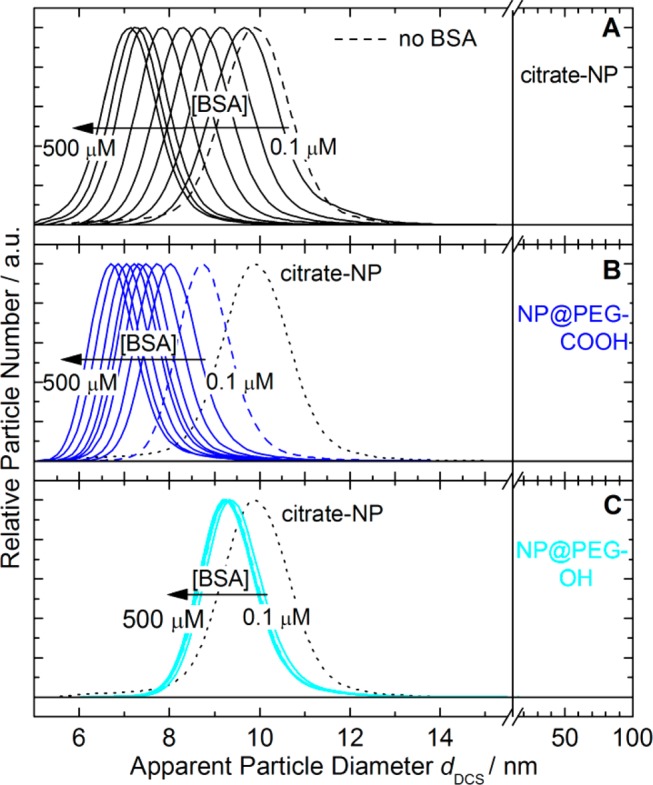
Size distributions for (A) citrate- and (B,C) PEG-stabilized gold NPs, before (dashed lines) and after (solid lines) 24 h incubation in BSA solutions of different concentrations, as indicated. The data shown here were obtained with the same concentration of BSA in the DCS-gradient fluid as used during NP incubation. The dotted lines in parts B and C show the distribution for citrate-stabilized NPs in the absence of BSA.