
Figure 2.
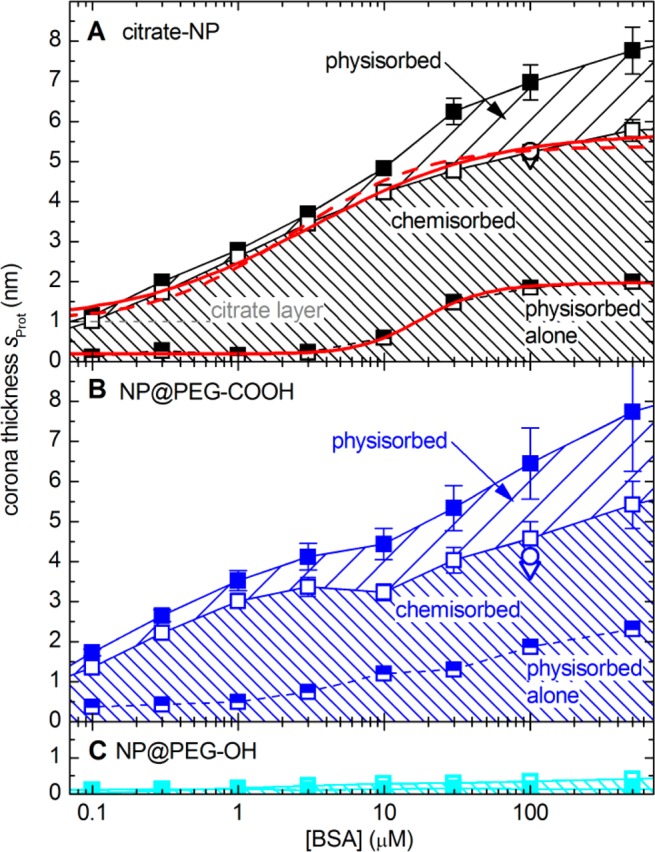
BSA corona thickness on (A) citrate- and (B,C) PEG-stabilized NPs after 24 h incubation at different BSA concentrations. Solid symbols refer to DCS-measurements with BSA present in the gradient fluid at the same concentration as during incubation, open symbols refer to DCS-measurements in the absence of BSA in the gradient fluid, and solid/open symbols show the difference between these results. The open circles at [BSA] = 100 μM show the results obtained immediately after removal of excess BSA from the sample by centrifugation, the open down-triangles those obtained for the same samples 24 h later. The solid red lines in panel A are fits of the data to the Hill model, eqs 5 and 6, yielding values of smax = (5.7 ± 0.2) nm, KD = (7.0 ± 2.5) μM, n = (0.75 ± 0.10) for chemisorbed BSA on citrate-NPs, and smax = (2.0 ± 0.1) nm, KD = (17.8 ± 1.5) μM, n = (2.0 ± 0.3) for the additional physisorbed protein layer; the dashed red line is a fit of the data to a Langmuir isotherm (eqs 5 and 6 for n = 1), yielding KD = (4.1 ± 0.9) μM.