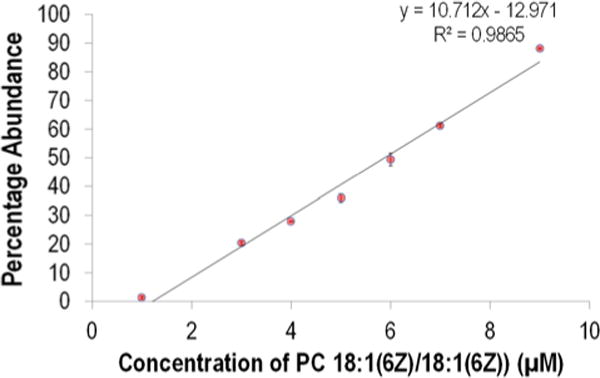
Figure 5.

Plot confirming the linear relationship between the concentration of PC 18:1(6Z)/18:1(6Z) (x-axis) and the percentage of the abundance that the diagnostic ions from PC 18:1(6Z)/18:1(6Z) (m/z 606 + m/z 630) comprise relative to the total abundance of all the diagnostic ions ion (m/z 606 + m/z 630 + m/z 648 + m/z 672) (y-axis). Mixtures containing various ratios of the isomers PC 18:1(6Z)/18:1(6Z) and PC 18:1(9Z)/18:1(9Z) (with a fixed total concentration of 10 μM) were analyzed.
