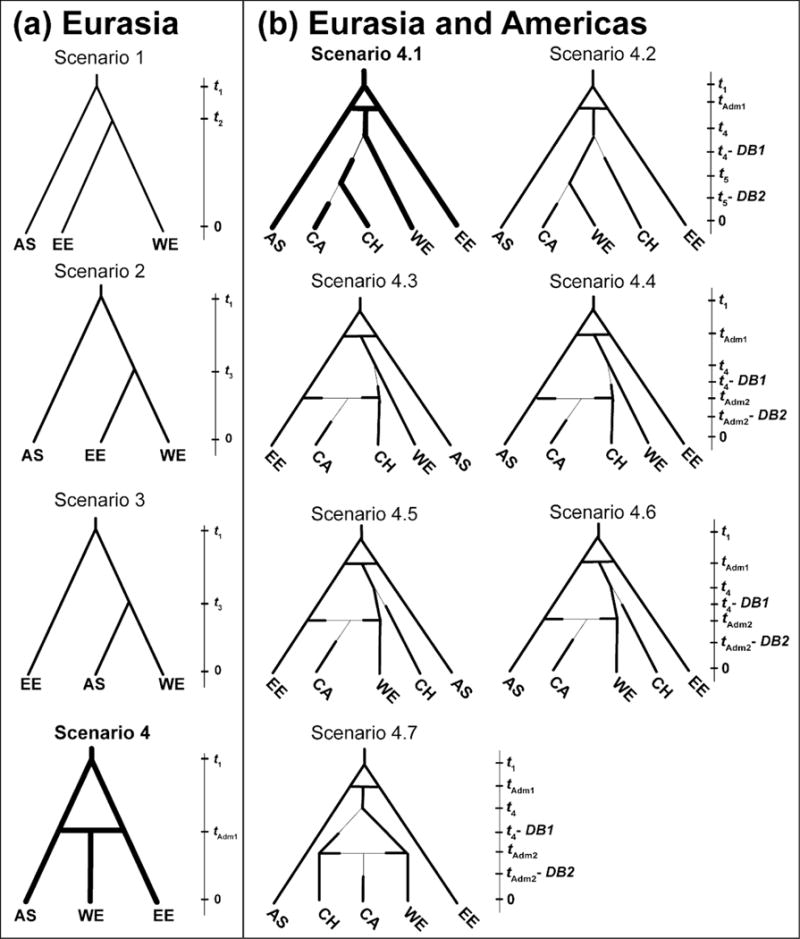
Fig. 1.

Evolutionary scenarios tested for two successive steps of ABC analyses of range expansions of the core lineage of YST. The first analysis (a) tested among four evolutionary scenarios for populations in Eurasia. The second analysis (b) incorporated the most highly supported scenario from (a) to test among seven competing evolutionary scenarios for the invasion of California. Scenarios are shown together with their respective tree topologies and relative times of divergence (t1 represents the oldest split and 0 represents the present day) and admixture (tAdm1 and tAdm2). Narrow lines in topologies of (b) indicate population bottlenecks at times DB1 and DB2. Times are not to scale. The best-fit scenario for each analysis is indicated with a bold topology. Additional details regarding evolutionary scenarios and prior distributions for their demographic parameters are described in Appendix S1 and Table S2 (Supporting information) respectively.
