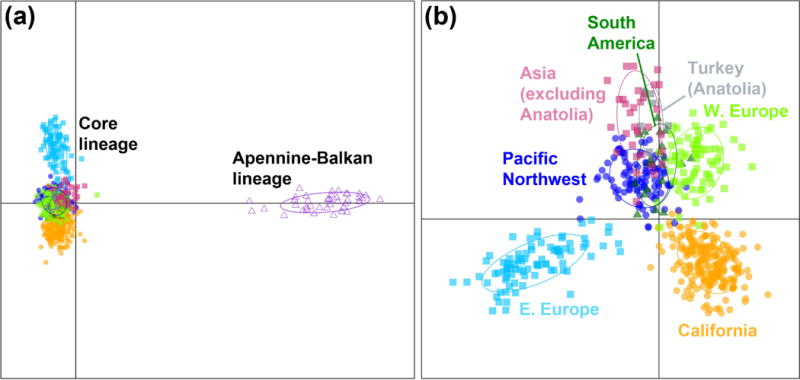
Fig. 2.

Discriminant analysis of principal components (DAPC) based on single nucleotide polymorphisms, using regions as prior clusters. Results are shown for (a) the analysis that included YST individuals from across the entire sampled range (i.e. the “FULL” data set) and (b) the analysis that included only individuals belonging to the core lineage (i.e. the “CORE” data set). Ovals are 95% inertia ellipses. Individual genotypes are depicted with closed squares (Eurasia), closed triangles (South America), dots (western US), and open triangles (southern Apennine and Balkan Peninsulas), and are colored according to the geographic region from which they were sampled.
