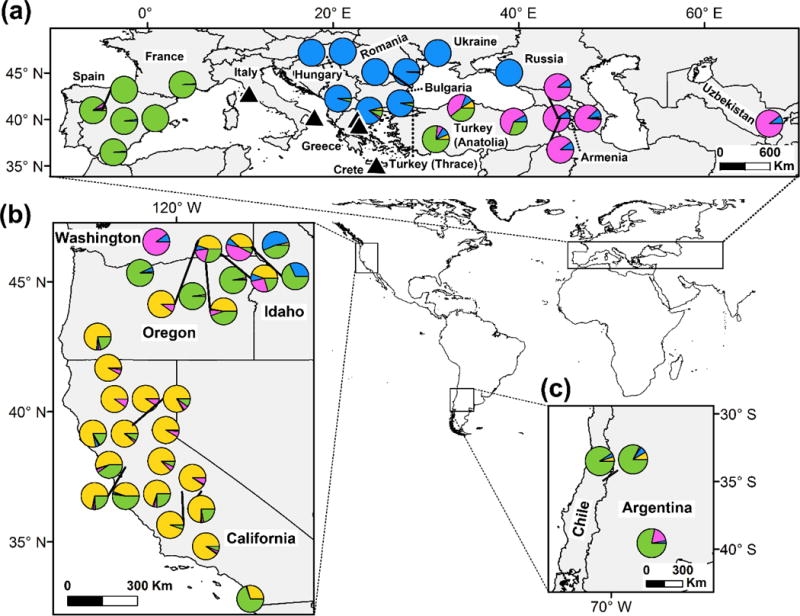
Fig. 4.

Pie charts depicting the average assignment probabilities of individuals of the core lineage of YST at each sampling site in Eurasia (a), the western US (b), and South America (c) to a genetic cluster inferred by STRUCTURE analyses at K = 4 (the average of ten replicates), where K is the number of genetic clusters. Black leader lines indicate the geographic location of nearby sampling sites. Black triangles in Eurasia indicate sampling sites for populations of the divergent Apennine-Balkan lineage of YST.
