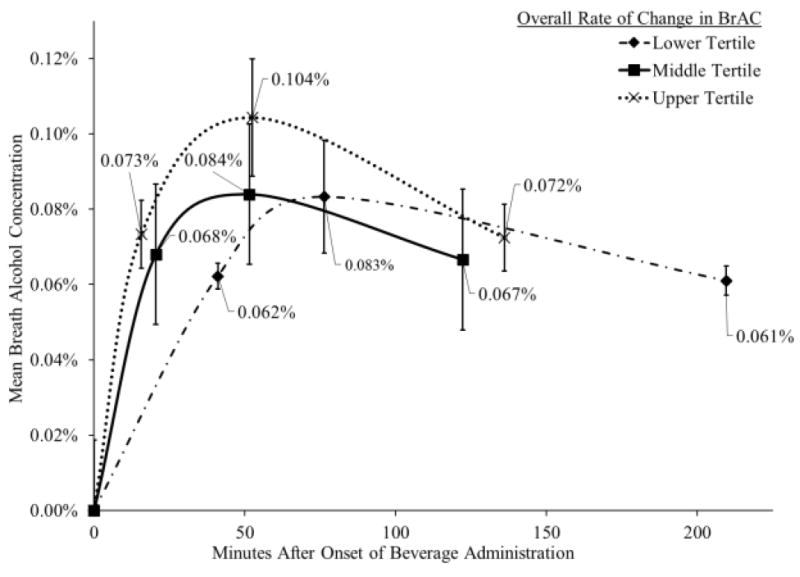
Figure.1.

Separate mean breath alcohol concentrations (BrACs) trajectories for upper, middle, and lower tertiles for overall change in BrAC. Dotted line with × markers represents change in BrAC over time for participants in the upper tertile (i.e., faster) for overall change in BrAC. Solid line with filled square markers represents change in BrAC over time for participants in the middle tertile for overall change in BrAC. Dashed line with filled diamond markers represents change in BrAC over time for participants in the lower tertile (i.e., slower) for overall change in BrAC. Numerical values and capped vertical lines reflect the mean and standard deviation, respectively, at each time point.
