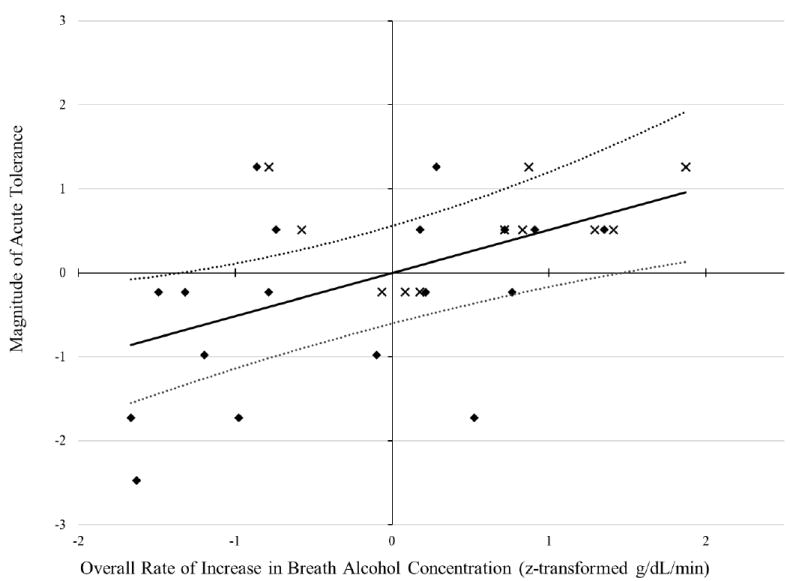
Figure 2.

Plot of standardized regression equation predicting acute tolerance magnitude from the overall rate of increase in breath alcohol concentration (BrAC). The solid and dotted lines, respectively, depict the multiple linear regression and 95% confidence interval predictions from the full model with covariates. The diamond symbols represent the standardized raw data for women, while the × symbols represent the standardized raw data for men. The x- and y-axes have a mean and standard deviation of 0 and 1, respectively.
