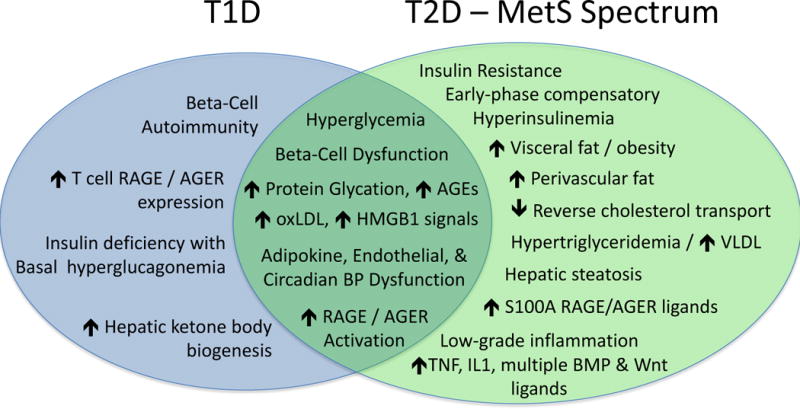
Figure 1. Overlapping yet distinct metabolic milieus of T1D and the T2D-MetS spectrum shape cardiovascular disease.

T1D and T2D share many cardiometabolic risk factors – including elevated levels of multiple ligands169–174 capable of activating the RAGE/AGER and toll like receptors (TLRs) of the innate immune system that can drive arterial calcification100, 101, 175 along with prototypic inflammatory cytokines (TNF, IL1beta, etc.)70, 90, 176, 177. Note that expanded visceral and perivascular (aortic, coronary) fat depots1, 178–182 and hepatic steatosis183–186 – harbingers of valve and vascular calcification – are key features of the “diabesity” phenotype along the T2D-MetS spectrum12, 187–189. T2D also impairs reverse cholesterol transport190, and VLDL metabolism is an independent contributor to arterial calcification risk191. AGE, advanced glycation end product; BMP, bone morphogenetic protein; BP, blood pressure; HMGB1, high mobility group protein B1; oxLDL, oxidized LDL cholesterol.
