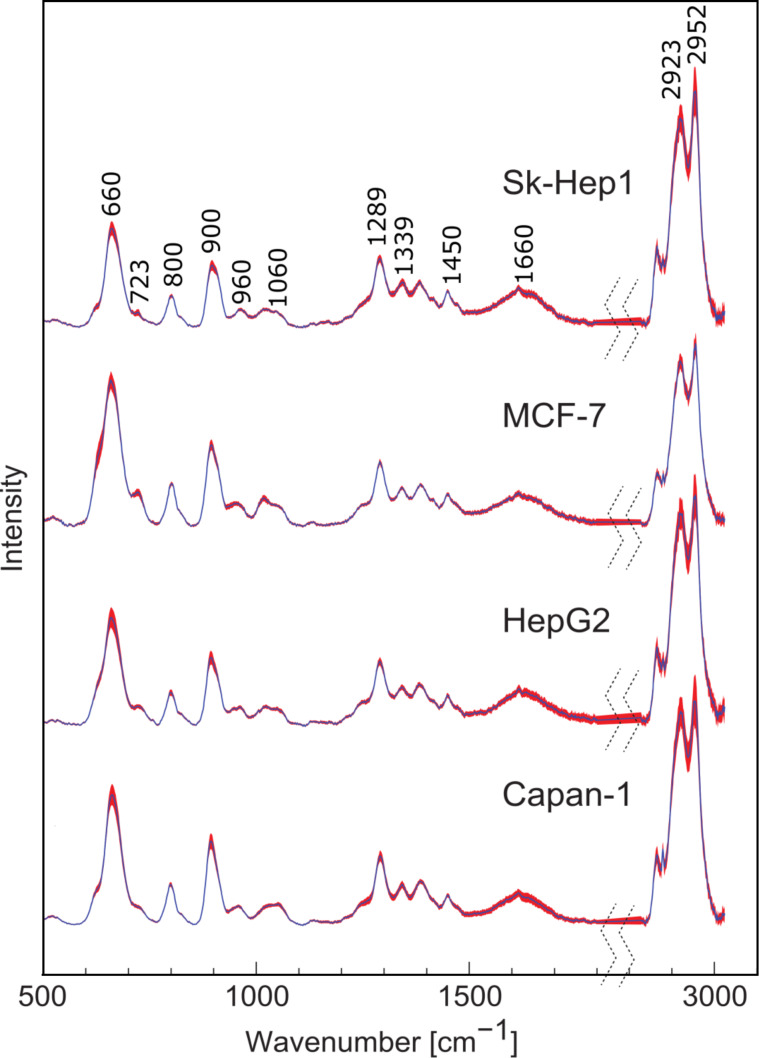
Figure 3.
Preprocessed mean SERS spectra and standard deviations of the different cell lines. Labeled bands are assigned to cellular biomolecules including nucleic acids, proteins and carbohydrates. The low standard deviation values (represented by the red shadow) emphasize the high reproducibility of the technique.

