
Figure 1.
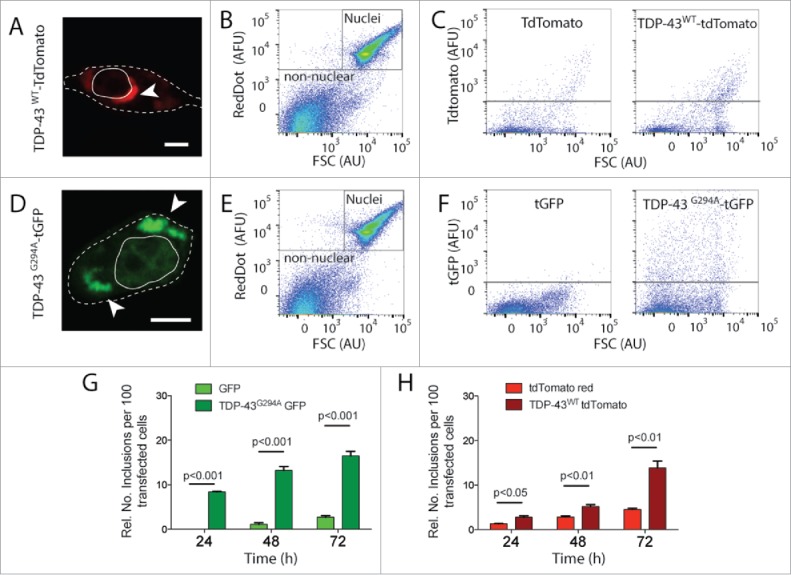
FloIT quantifies TDP-43 inclusions in NSC-34 cells. NSC‐34 cells were transiently transfected with either TDP-43WT–tdTomato or TDP-43G294A-tGFP fusion proteins and incubated for either 24, 48 or 72 h. (A, D) Confocal microscopy identifies extra nuclear TDP-43 that has formed distinct inclusions (white arrow head; Scale bar 5 μm). Dashed line represents cell border from transmission image enclosed line represents the nucleus. (B, E) Representative 2 parameter, pseudo-color flow cytometry plots showing identification of nuclei and non-nuclear particles (indicated) on the basis of forward scatter (FSC; arbitrary units, AU) and RedDot2 fluorescence (arbitrary fluorescence units, AFU). (C, F). Non-nuclear particles (gated as shown in representative plots (B, E)) analyzed for tdTomato (C) or tGFP (F) fluorescence versus FSC in lysates prepared from cells transfected with plasmids encoding TDP-43WT–tdTomato or TDP-43G294A-tGFP or fluorescent proteins alone (left). Inclusions are identified by their tdTomato or tGFP fluorescence. (G, H) Quantification of inclusions (FloIT) as number of inclusions per 100 transfected cells formed by TDP-43G294A-tGFP and TDP-43WT–tdTomato, compared with lysates prepared from cells expressing fluorescent proteins only. Results shown are the mean number of inclusions per 100 transfected cells ± SEM, n = 3 independent experiments. Significant differences indicated with p value represent unpaired T-test comparisons between treatments indicated by line.