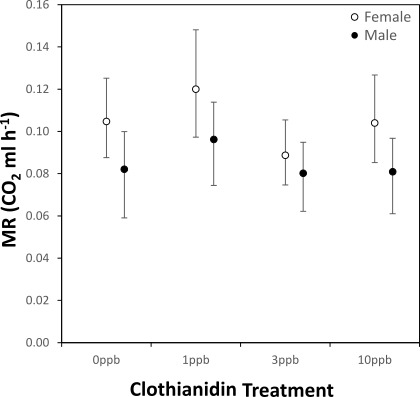
Figure 4. Metabolic rate for male (black circles, n = 48) and female bees (open circles, n = 54) exposed to varying concentrations of clothianidin during development.

Data are least-square means (±CI) estimated by an ANCOVA performed for each sex, with treatment and gas exchange pattern as a main effect and log-transformed adult body mass as a co-variate (Females = 72.03 mg, Males = 46.57 mg).
