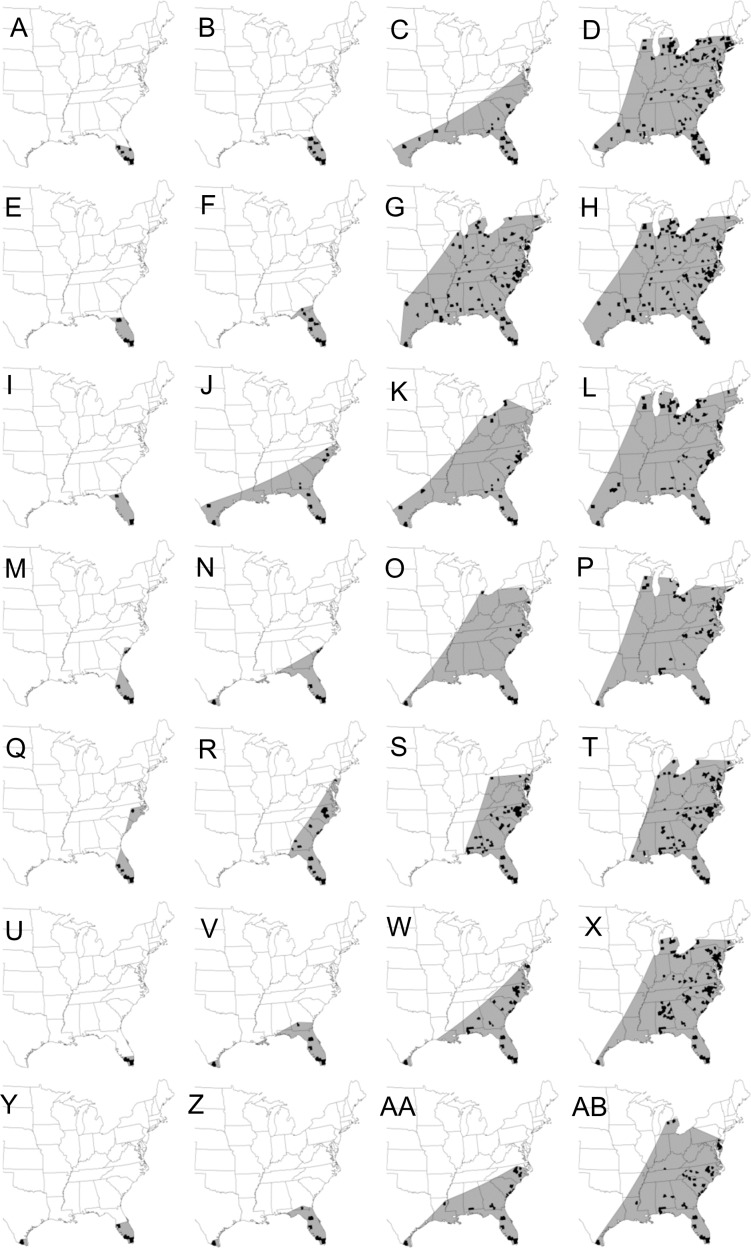
Figure 1. Maps showing the spatial spread of the epidemic wave-front of cucurbit downy mildew in the eastern United States.
Maps depicting the continental spread of cucurbit downy mildew across the eastern United States based on cumulative county-level reports of new outbreaks (black fill). The area of epidemic extent (gray shade) is calculated by connecting outbreaks at the leading edges of the epidemic wave-front with a straight line. Epidemic years are presented consecutively in rows with the first row being 2008 and the last row being 2014. For each year, maps are for the epidemic on calendar week 16 in April (first column: A, E, I, M, Q, U, Y), week 20 in May (second column: B, F, J, N, R, V, Z), week 24 in June (third column: C, G, K, O, S, W, AA) and week 28 in July (fourth column: D, H, L, P, T, X, AB). Epidemic maps for 2008 and 2009 were published as preliminary data in Ojiambo et al. (2015).

